The month of June occupies a unique and often volatile space in the financial calendar. As the final month of the second quarter and the conclusion of the first half of the year, it serves as a critical barometer for investor sentiment, corporate health, and macroeconomic stability. For seasoned investors and casual observers alike, understanding how the stock market performs in June requires looking beyond simple percentage gains or losses. It involves dissecting the interplay between historical seasonal trends, central bank policies, and the shifting tides of sector-specific momentum.
Historically, June is often characterized by a “wait-and-see” atmosphere. With the “Sell in May and Go Away” adage still ringing in the ears of market participants, June frequently acts as a transition period where the exuberance of spring meets the lower-liquidity “summer doldrums.” However, in the modern financial era, June has frequently defied these clichés, often providing the backdrop for significant rallies or necessary corrections that set the stage for the second half of the year.
1. Historical Seasonality and the June Market Narrative
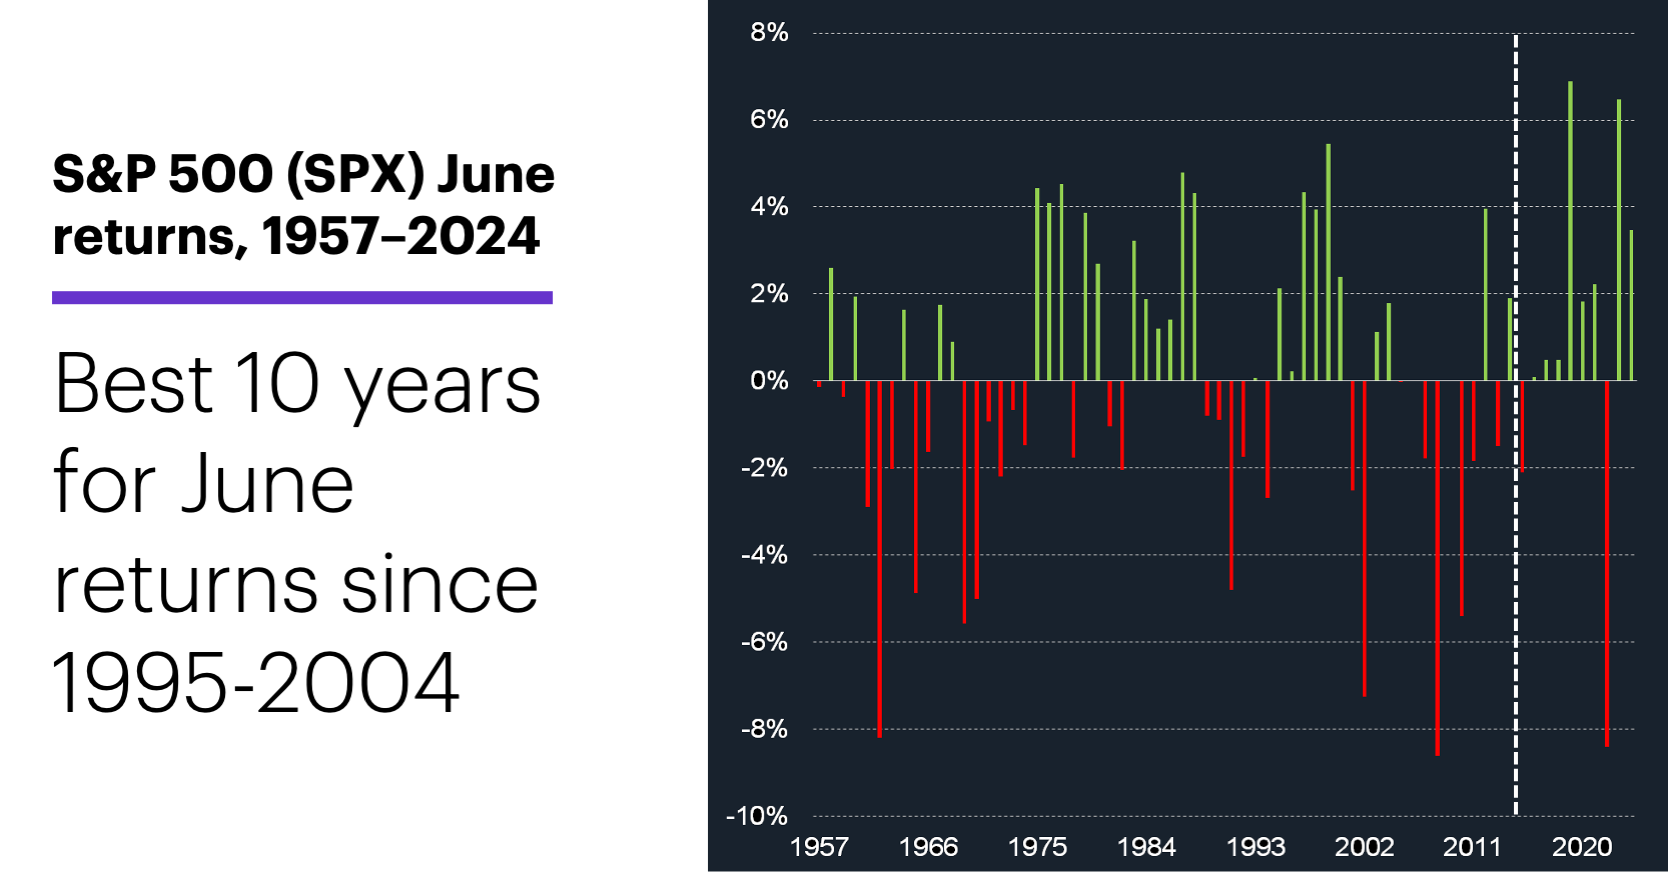
To understand June’s performance, one must first address the historical context of the “mid-year slump.” Traditionally, June has not been the strongest month for equities, often ranking in the middle or lower tier of monthly returns over the last several decades. However, averages can be deceiving, and the nuances of market behavior during this period are essential for strategic asset allocation.
The Myth and Reality of “Sell in May”
The old Wall Street proverb suggests that investors should exit their positions in May and return after Halloween to avoid the seasonally weak summer months. While there is some historical data supporting lower average returns during the summer, June often sees a phenomenon known as “window dressing.” This occurs toward the end of the month when institutional fund managers buy top-performing stocks to improve the appearance of their portfolios before quarterly reports are released to clients. This institutional activity can provide a late-month cushion, preventing deeper pullbacks even if the first two weeks of the month are sluggish.
Volatility Patterns in the Second Quarter
June is also the month of “Quadruple Witching”—the simultaneous expiration of stock options, stock index futures, stock index options, and market index futures. This usually occurs on the third Friday of the month. The result is often a massive spike in trading volume and localized volatility. For investors, this means that mid-June performance is frequently dictated by technical positioning rather than fundamental shifts. Understanding that June’s volatility is often “mechanical” rather than “structural” helps investors maintain a long-term perspective during temporary price swings.
2. Macroeconomic Catalysts: Inflation, Interest Rates, and the Fed
In recent years, the performance of the stock market in June has been tethered almost exclusively to the actions and rhetoric of the Federal Reserve. Because June marks a mid-point in the fiscal year, the FOMC (Federal Open Market Committee) meetings during this month are scrutinized for hints regarding the interest rate trajectory for the remainder of the year.
The Influence of CPI and PPI Data
Market performance in June is heavily influenced by the release of the Consumer Price Index (CPI) and the Producer Price Index (PPI). If these reports show that inflation is cooling faster than expected, the market typically responds with a “relief rally,” particularly in growth-oriented sectors. Conversely, if June data suggests that inflation remains “sticky,” investors often pivot toward defensive postures, dragging down the major indices. The stock market’s June performance is, in many ways, a high-stakes reaction to the purchasing power of the dollar and the cost of borrowing.
Central Bank Rhetoric and the “Dot Plot”
Every June, the Federal Reserve provides an updated Summary of Economic Projections, which includes the famous “dot plot.” This chart represents where each Fed official expects interest rates to be in the future. Because the market is forward-looking, June performance is often driven by these projections rather than current economic conditions. If the “dots” suggest fewer rate cuts or more hikes than the market had priced in, June can become a month of aggressive re-pricing, leading to downward pressure on equity valuations.
3. Sector-Specific Performance and Investor Sentiment
The stock market is not a monolith, and June often highlights a stark divergence between different sectors. While the S&P 500 or the Nasdaq might show a certain percentage move, the underlying “market breadth”—the number of individual stocks participating in that move—tells a more detailed story of June’s financial health.
The Dominance of Growth and Technology
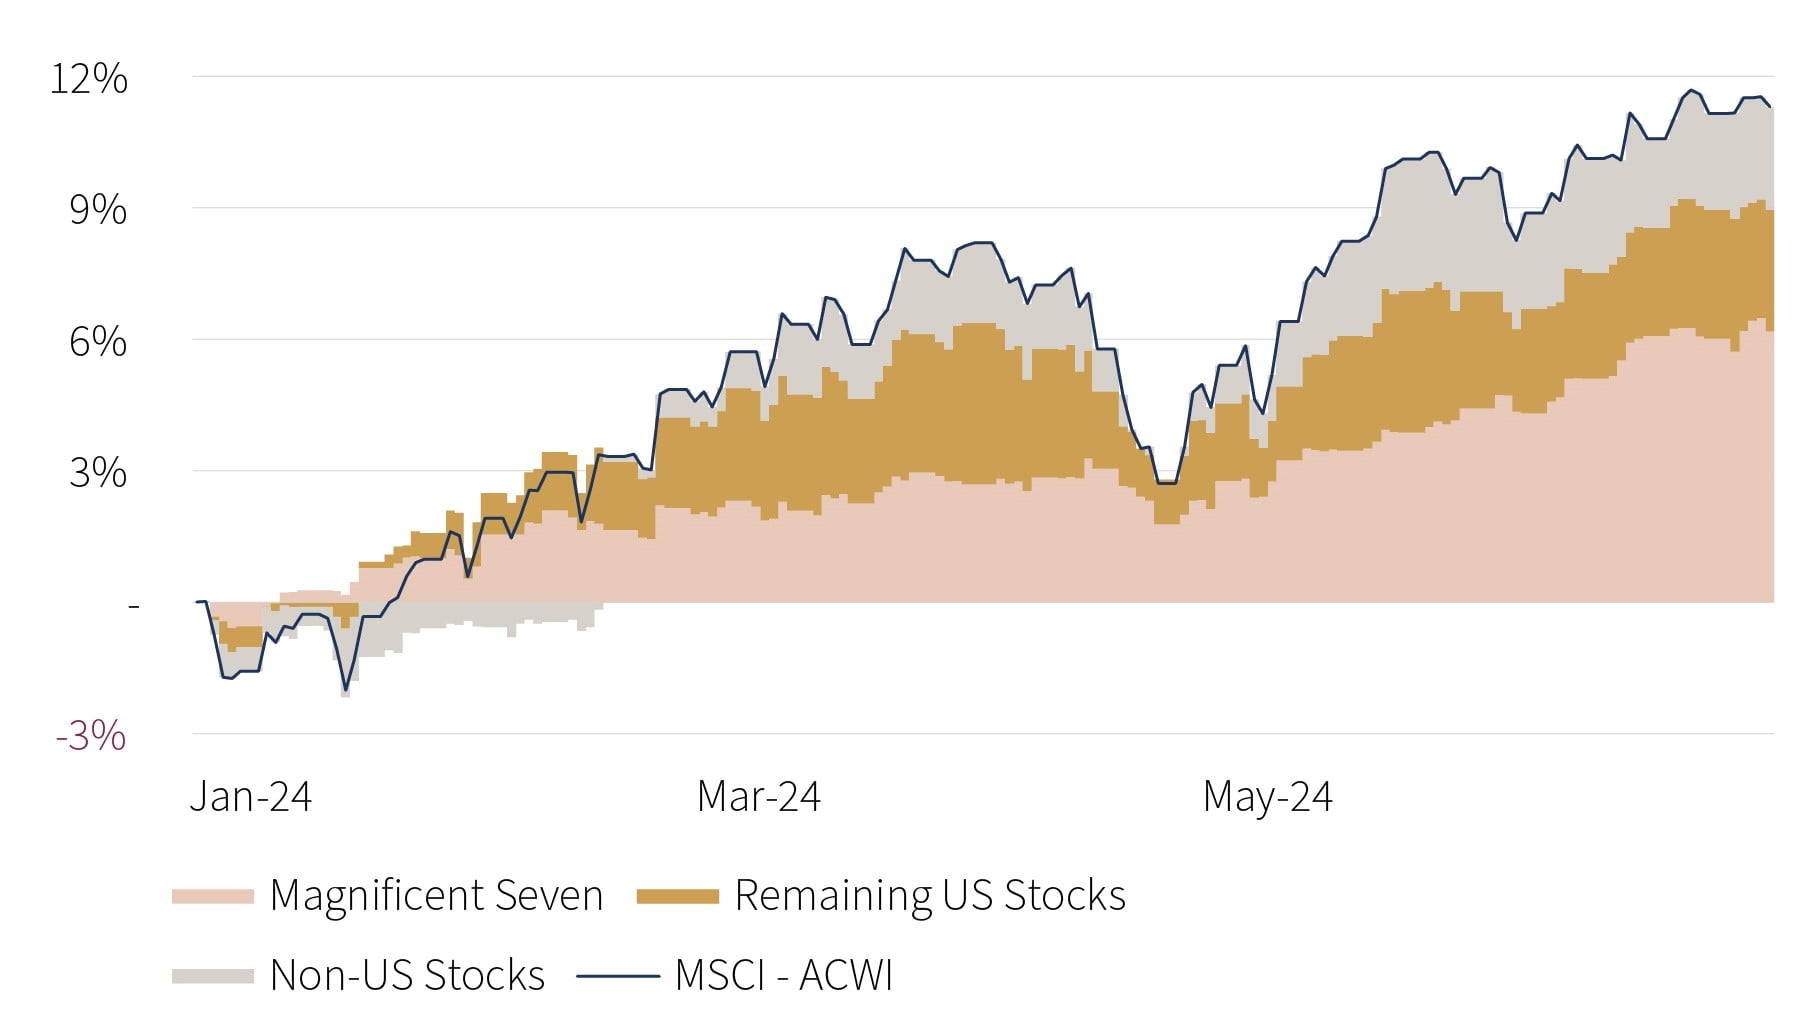
In the current economic landscape, June has frequently been a standout month for the Technology sector. As investors look toward the second half of the year, there is often a renewed appetite for companies with high earnings growth potential. This is especially true if interest rates appear to be peaking. The “AI revolution” and the strength of the “Magnificent Seven” stocks have, in recent Junes, acted as a localized engine for the broader market, often lifting the tech-heavy Nasdaq even when traditional industrial or energy stocks are flagging.
Defensive Rotations and Value Investing
When June market performance is characterized by uncertainty, money tends to flow into “defensive” sectors such as Utilities, Consumer Staples, and Healthcare. These sectors provide dividends and essential services that are less sensitive to economic cycles. A strong June for these sectors, coupled with weakness in Tech and Discretionary spending, is often interpreted as a “risk-off” signal. Analysts watch these internal rotations closely in June to determine if the market is preparing for a recession or a period of prolonged stagnation in the third quarter.
4. The Role of Corporate Earnings and Mid-Year Rebalancing
While June is technically “between” the major earnings seasons of Q1 and Q2, it is the month where “pre-announcements” happen. Companies that realize they will miss their Q2 targets often issue warnings in June, which can lead to sharp idiosyncratic moves in specific stocks and industries.
The Impact of “Whisper Numbers” and Guidance
In June, the market begins to trade on expectations for the July earnings season. If management teams provide upbeat guidance during mid-June investor conferences, it can create a positive feedback loop that drives the market higher. Conversely, if June is marked by a series of downward revisions in guidance—particularly regarding consumer spending or manufacturing output—the market performance for the month will likely be negative as investors “front-run” the bad news expected in July.
Portfolio Rebalancing and Capital Flows
Many institutional investors and pension funds rebalance their portfolios at the end of June to maintain their desired asset allocation (e.g., a 60/40 split between stocks and bonds). If the stock market had a very strong April and May, rebalancing in June might actually involve selling stocks to buy bonds, creating a natural “ceiling” for June’s gains. This flow of funds is a critical, yet often overlooked, component of how the market performs during the final weeks of the month.
5. Strategic Takeaways: How Investors Should Interpret June Results
Reflecting on the performance of the stock market in June requires a balanced view of both technical data and psychological trends. It is rarely a month of “settled” trends; rather, it is a month of preparation and positioning.
Assessing Market Health for the Second Half
A strong June performance, especially one characterized by high volume and broad participation across multiple sectors, is often seen as a bullish signal for the rest of the year. It suggests that investors are willing to “climb the wall of worry” and are optimistic about the upcoming Q2 earnings. On the other hand, a lackluster or “flat” June is not necessarily a disaster; it often represents a healthy period of consolidation after the gains of the first five months.
The Importance of Discipline Over Emotion
For the individual investor, June is a reminder of the importance of financial discipline. Whether the market is soaring on tech optimism or dipping due to Fed fears, the performance of a single month should rarely dictate a total change in investment strategy. Instead, June serves as an ideal time to review personal finance goals, assess risk tolerance, and ensure that a portfolio is diversified enough to handle the potential volatility of the summer months and the high-stakes earnings reports that follow in July.
In conclusion, the stock market’s performance in June is a complex tapestry woven from historical seasonal patterns, the heavy hand of monetary policy, and the strategic rebalancing of global institutions. By understanding these underlying forces, investors can move past the headlines and gain a clearer picture of where the market stands at the year’s midpoint, allowing for more informed decisions in the months to come.
aViewFromTheCave is a participant in the Amazon Services LLC Associates Program, an affiliate advertising program designed to provide a means for sites to earn advertising fees by advertising and linking to Amazon.com. Amazon, the Amazon logo, AmazonSupply, and the AmazonSupply logo are trademarks of Amazon.com, Inc. or its affiliates. As an Amazon Associate we earn affiliate commissions from qualifying purchases.