When investors speak about “the market,” they are almost always referring to the S&P 500. As the primary benchmark for the United States equity market, the S&P 500 tracks the performance of 500 of the largest, most influential companies listed on American stock exchanges. For anyone looking to build wealth through personal finance and investing, understanding the average return of this index is not just a matter of curiosity—it is a fundamental component of financial planning.
The “average return” is a figure often quoted in financial literature, but it is frequently misunderstood. To harness the power of the stock market, one must look beyond the surface-level percentages and understand how these returns are calculated, what influences them, and how they translate into actual wealth over decades.
Understanding the Benchmark: Why the S&P 500 Matters
Before diving into the specific percentages, it is essential to define what we are measuring. The S&P 500 is more than just a list of companies; it is a reflection of the health of the American corporate landscape and, by extension, a significant portion of the global economy.
What Exactly is the S&P 500?
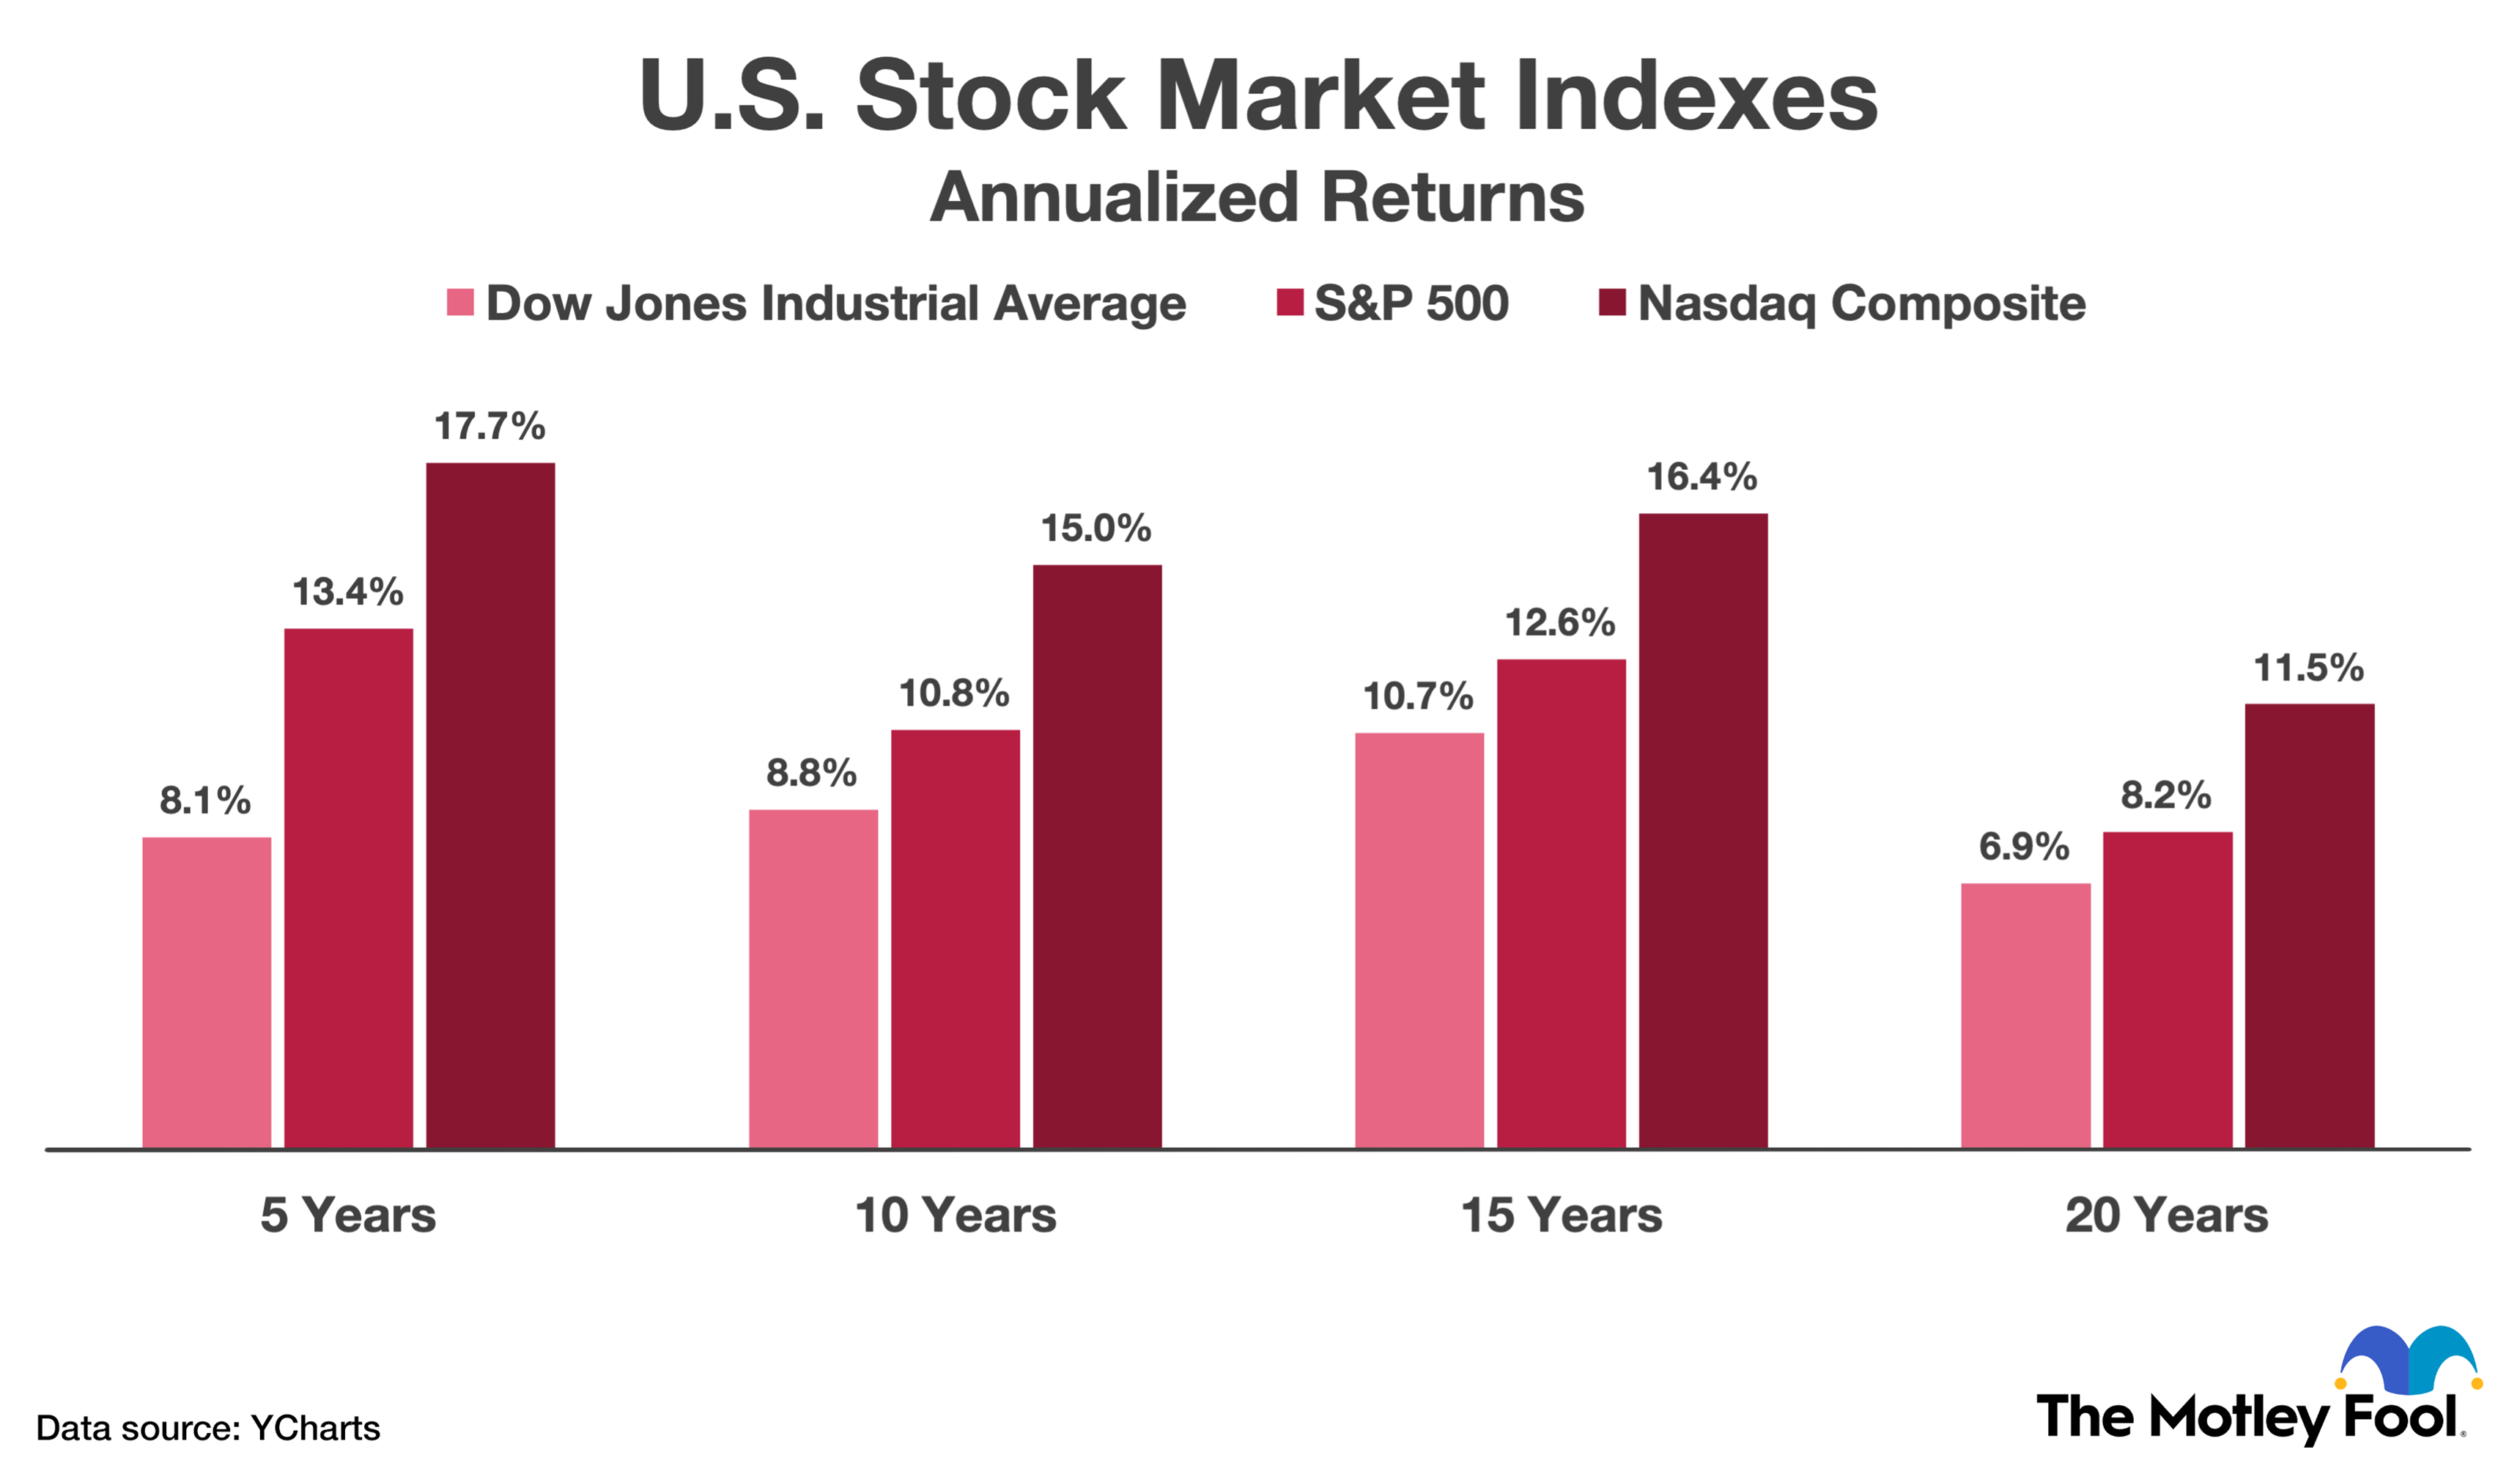
Maintained by S&P Dow Jones Indices, the S&P 500 includes 500 leading companies and covers approximately 80% of available market capitalization. Unlike the Dow Jones Industrial Average, which is price-weighted, the S&P 500 uses a market-capitalization-weighted formula. This means that larger companies, such as Apple, Microsoft, and Amazon, have a more significant impact on the index’s performance than smaller constituents. This structure makes it a highly accurate barometer for the overall movement of the large-cap U.S. stock market.
Market Cap Weighting and Its Impact
Because the index is market-cap weighted, its “average return” is heavily influenced by the technology and consumer discretionary sectors in the modern era. When an investor asks about the average return, they are essentially asking: “How much has the collective value of the most successful American corporations grown over time?” Because the index periodically drops underperforming companies and adds rising stars, it possesses a “survivorship bias” that naturally leans toward growth and profitability over long horizons.
Decoding the Numbers: Historical Performance and Statistics
When financial advisors discuss the S&P 500, they often cite a specific “magic number.” However, the timeframe used to calculate that average can change the result significantly.
The 10% Rule of Thumb
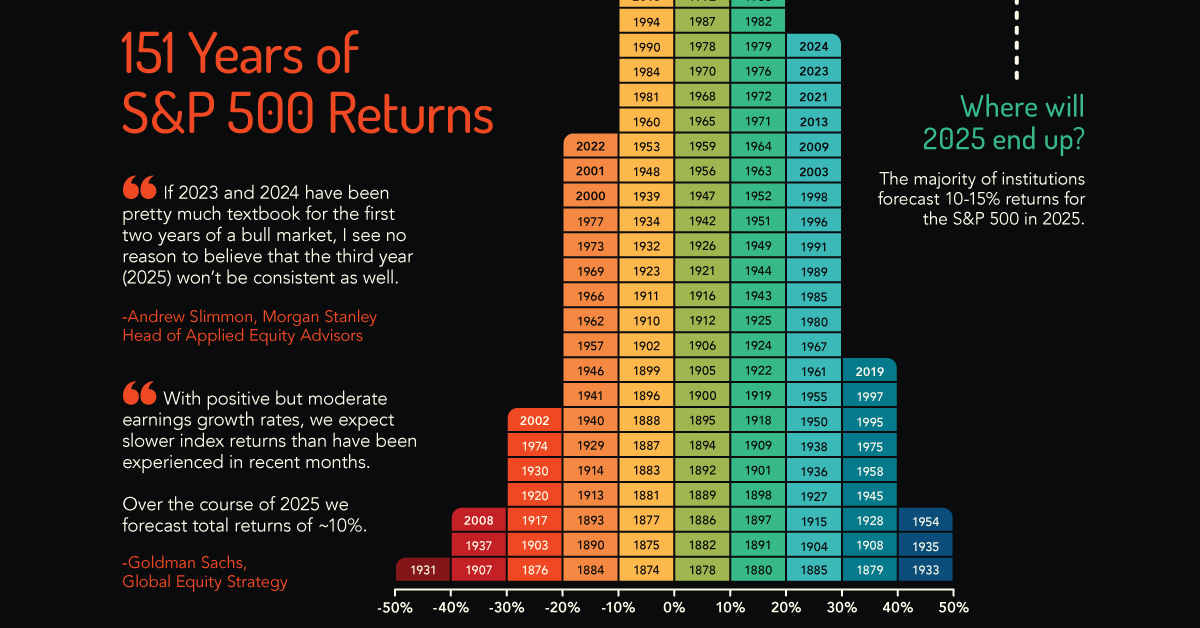
Historical data shows that since its inception in its modern form in 1957 through the end of 2023, the S&P 500 has posted an average annual return of approximately 10.26%. If we look even further back to the index’s precursors in the 1920s, the figure remains remarkably consistent, hovering between 9% and 11%. For a personal finance enthusiast, this 10% figure is the cornerstone of the “Rule of 72,” suggesting that an investment in the S&P 500 could theoretically double every seven to eight years.
Nominal vs. Real Returns (Adjusting for Inflation)
While a 10% return sounds impressive, investors must distinguish between nominal returns and real returns. Nominal return is the raw percentage increase, while real return accounts for the eroding effects of inflation. Historically, inflation averages around 2% to 3% per year. Therefore, the “real” purchasing power of an S&P 500 investment has historically grown by about 7% annually. When planning for retirement or long-term goals, using the 7% real return figure provides a more realistic expectation of future lifestyle affordability.
The Impact of Dividends on Total Return
A common mistake among novice investors is looking only at the “price return” of the index—the change in the index level itself. However, many companies in the S&P 500 pay dividends. When these dividends are reinvested into the market, they create a “total return” that is significantly higher than the price return alone. Over long periods, reinvested dividends have accounted for nearly 40% of the total wealth generated by the S&P 500. This highlights the importance of choosing investment vehicles, such as total-return ETFs, that allow for seamless dividend reinvestment.
Factors That Influence Yearly Performance Volatility
While the long-term average is roughly 10%, the S&P 500 almost never returns exactly 10% in a single year. In fact, “average” years are the exception, not the rule. The market is defined by its volatility, driven by a complex interplay of internal and external factors.
Economic Cycles and Bull vs. Bear Markets
The stock market moves in cycles. Bull markets, characterized by rising prices and investor optimism, can see annual returns exceeding 20% or 30%. Conversely, bear markets—defined by a decline of 20% or more from recent highs—can see the index plummet significantly in a short period. Understanding that the 10% average is the result of averaging out +30% years with -20% years is crucial for emotional resilience during market downturns.
Interest Rates and Federal Reserve Policy
One of the most potent drivers of S&P 500 performance is the cost of borrowing. When the Federal Reserve lowers interest rates, it becomes cheaper for companies to borrow money for expansion, and consumer spending typically increases. This generally boosts corporate profits and stock prices. When rates rise to combat inflation, growth often slows, and the “discount rate” applied to future earnings increases, which can lead to lower stock valuations.
Geopolitical Events and Market Sentiment
Markets do not exist in a vacuum. Wars, trade disputes, elections, and global health crises (like the COVID-19 pandemic) create uncertainty. Investors generally dislike uncertainty, often leading to “sell-offs” during periods of geopolitical tension. However, history has shown that the S&P 500 is incredibly resilient, often recovering from these shocks faster than analysts predict as the underlying companies adapt to the new global reality.
The Power of Time: Compound Interest and Long-Term Holding
The true secret to benefiting from the S&P 500’s average return is not found in complex trading algorithms, but in the simple passage of time. The mathematical phenomenon of compound interest transforms linear growth into exponential wealth.
The Danger of Market Timing
Many investors attempt to “beat the market” by jumping out before a crash and jumping back in before a recovery. Statistics consistently show that this is a losing game. Missing out on just the ten best-performing days of the market over a 20-year period can result in an ending balance that is nearly 50% lower than if the investor had simply stayed put. Because the average return is skewed by a few extremely high-performing days, “time in the market” is vastly superior to “timing the market.”
Dollar-Cost Averaging as a Strategy
Since we know the market is volatile but generally trends upward, the most effective strategy for the average person is Dollar-Cost Averaging (DCA). By investing a fixed amount of money at regular intervals (e.g., $500 every month), you automatically buy more shares when prices are low and fewer shares when prices are high. This lowers your average cost per share over time and removes the emotional stress of trying to pick the “perfect” moment to enter the market.
How to Incorporate S&P 500 Returns into Your Financial Plan
Knowing the average return is only useful if you have a mechanism to capture it. Fortunately, modern financial tools have made it easier than ever for individual investors to access the performance of the S&P 500.
Selecting the Right Investment Vehicles (ETFs and Index Funds)
You cannot invest “directly” in an index, but you can invest in funds that track it. Low-cost Exchange-Traded Funds (ETFs) like Vanguard’s VOO, BlackRock’s IVV, or State Street’s SPY are designed to mirror the S&P 500. The key metric to look for here is the “expense ratio.” Because the S&P 500 return is a commodity, you should pay as little as possible for it. Many top-tier S&P 500 ETFs have expense ratios as low as 0.03%, meaning you keep 99.97% of the market’s returns.

Risk Management and Diversification
While the S&P 500 is a diversified basket of 500 companies, it still represents a single asset class: large-cap U.S. equities. A robust financial plan should consider whether the S&P 500’s risk profile matches the investor’s timeline. As one approaches retirement, it is often wise to balance the S&P 500 with bonds or international equities to reduce the impact of a potential market crash at an inopportune time. However, for those with a decade or more until they need their funds, the historical average return of the S&P 500 remains one of the most reliable engines for wealth creation in the history of finance.
In conclusion, the average return of the S&P 500—roughly 10% nominally and 7% after inflation—is a testament to the long-term growth of the American economy. While the journey is rarely a smooth line, the historical trend is clear. By understanding these numbers and maintaining a disciplined, long-term perspective, investors can stop worrying about daily fluctuations and start building a secure financial future.
aViewFromTheCave is a participant in the Amazon Services LLC Associates Program, an affiliate advertising program designed to provide a means for sites to earn advertising fees by advertising and linking to Amazon.com. Amazon, the Amazon logo, AmazonSupply, and the AmazonSupply logo are trademarks of Amazon.com, Inc. or its affiliates. As an Amazon Associate we earn affiliate commissions from qualifying purchases.