
Slugging percentage, often abbreviated as SLG, is a fundamental statistic in baseball that provides a more nuanced understanding of a hitter’s power and offensive impact than simple batting average. While batting average tells us how often a player gets a hit, slugging percentage quantifies the quality of those hits, rewarding extra-base hits more significantly. In the intricate world of baseball analytics, understanding slugging percentage is crucial for evaluating player performance, building competitive teams, and even informing strategic decisions. This deep dive will explore the definition, calculation, significance, and historical context of slugging percentage, illustrating why it’s an indispensable tool for any serious baseball observer.

The Core Concept: Quantifying Power Through Bases Gained
At its heart, slugging percentage is designed to measure a batter’s power by summing the total number of bases a player reaches on their hits and dividing it by the total number of at-bats. This “total bases” component is the key differentiator from batting average. A single is worth one base, a double is worth two, a triple is worth three, and a home run is worth four. By weighting extra-base hits more heavily, slugging percentage effectively captures a hitter’s ability to drive the ball and produce significant run-scoring opportunities.
Defining the Components: At-Bats and Total Bases
To truly grasp slugging percentage, we must first understand its two primary components: at-bats and total bases.
At-Bats (AB)
An at-bat is a specific type of plate appearance that contributes to a batter’s average and slugging percentage. Generally, an at-bat is recorded when a batter completes their turn at the plate, resulting in a hit, an out, or reaching base on an error. However, certain plate appearances do not count as at-bats, such as walks, hit by pitches, sacrifices, and catcher’s interference. These are excluded because they don’t reflect a batter’s ability to make contact and hit the ball effectively. For instance, a player who draws many walks might have a high on-base percentage but a lower slugging percentage if those walks don’t translate into powerful hits. The strict definition of an at-bat ensures that slugging percentage remains a measure of a hitter’s hitting prowess.
Total Bases (TB)
Total bases are the sum of all bases gained from hits by a single batter. This is where the “slugging” aspect comes into play.
- A single (1B) contributes 1 total base.
- A double (2B) contributes 2 total bases.
- A triple (3B) contributes 3 total bases.
- A home run (HR) contributes 4 total bases.
It’s important to note that only hits count towards total bases. If a player hits a ball that would have been a double but they are thrown out at second base trying for the extra base, they are credited with a single and only 1 total base, not 2. Similarly, advancing on a wild pitch or passed ball after a hit does not add to the total bases for that specific hit. The calculation is purely based on the hit’s outcome in terms of bases gained.
The Formula: Putting the Pieces Together
The mathematical formula for slugging percentage is elegantly simple:
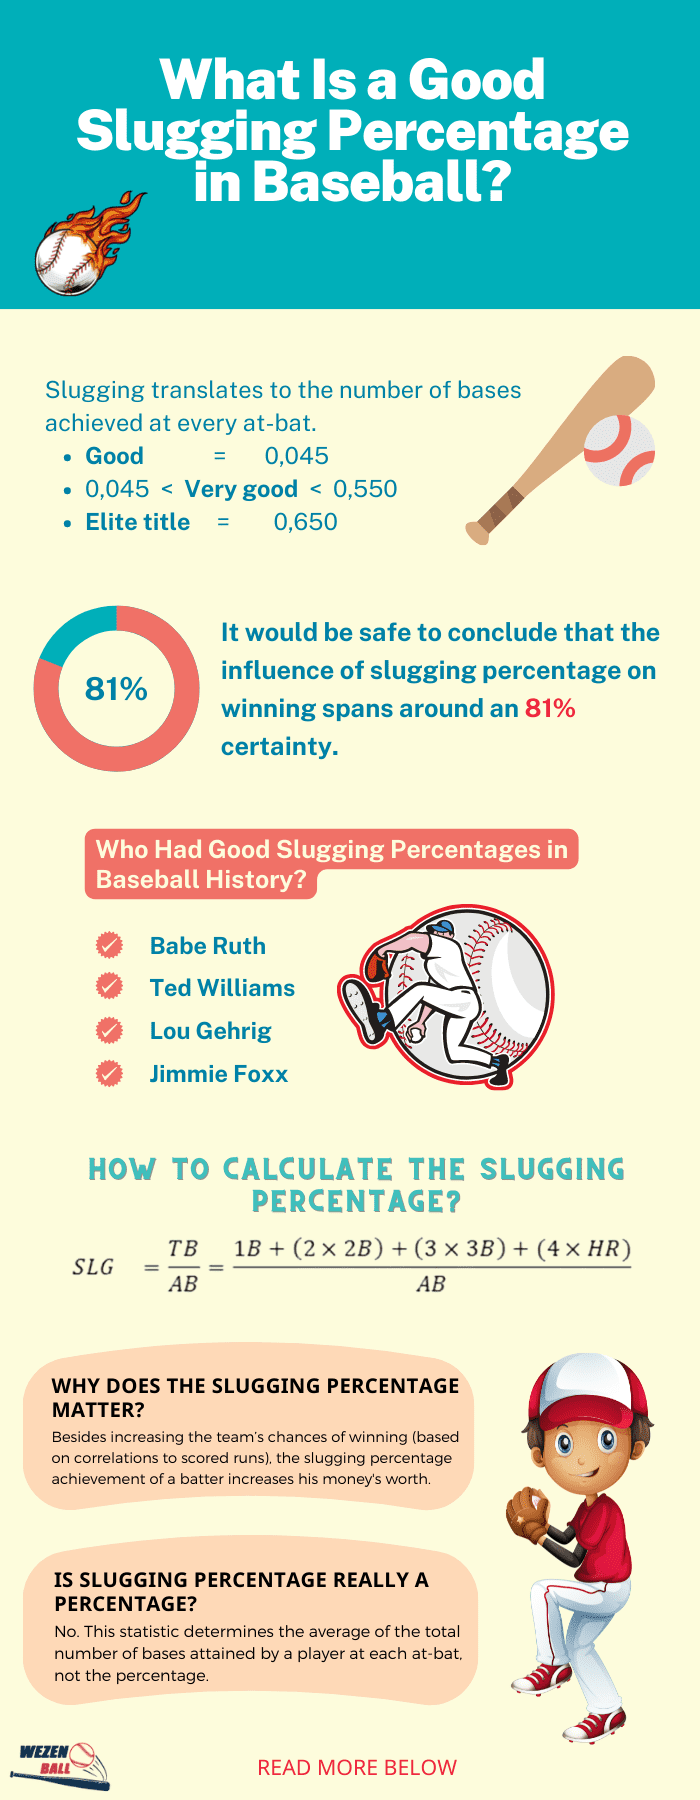
Slugging Percentage (SLG) = Total Bases (TB) / At-Bats (AB)
For example, if a player has 100 at-bats and accumulates 150 total bases, their slugging percentage would be 150 / 100 = 1.500. This number is typically expressed as a three-digit decimal. A slugging percentage above 1.000 indicates that the player averages more than one base per at-bat, which is a hallmark of a powerful hitter.
Interpreting the Numbers: What a High or Low SLG Tells Us
The value of slugging percentage lies not just in its calculation but in what it communicates about a player’s offensive capabilities. A high slugging percentage is universally desirable, indicating a player who can consistently drive the ball for extra bases and contribute significantly to run production. Conversely, a low slugging percentage suggests a player who primarily hits singles or struggles to generate extra-base hits.
Benchmarks and Comparisons: Contextualizing SLG
Understanding what constitutes a “good” slugging percentage requires context. League averages fluctuate year by year due to factors like ballparks, rule changes, and the general offensive environment. However, general benchmarks can be established:
- Above .500: Generally considered good to very good for a position player.
- Above .550: Excellent, indicating a truly dangerous power threat.
- Above .600: Elite, placing a player among the league’s best sluggers.
- Below .400: Generally considered below average for a regular starter, suggesting limitations in power.
It’s also crucial to compare a player’s slugging percentage to their peers at the same position and in the same league. A catcher with a .450 slugging percentage might be considered good, while a corner outfielder with the same number might be deemed insufficient if they aren’t contributing in other significant ways. Furthermore, comparing a player’s slugging percentage to their own career averages can reveal trends in their performance.
The Power-Speed vs. Power-Average Debate
Slugging percentage is often used in discussions about different types of hitters. A player with a high slugging percentage and a lower batting average might be characterized as a “slugger” or a “power hitter.” They might strike out more but make their outs count when they do make contact, often with extra-base hits. On the other hand, a player with a high batting average and a lower slugging percentage might be considered a “contact hitter” or a “line-drive hitter.” They get on base frequently with singles but don’t possess the same level of power to drive the ball for doubles and home runs.
Modern baseball analysis often emphasizes slugging percentage over batting average because extra-base hits are more valuable in generating runs. A single can lead to a run, but a double or home run significantly increases the probability of scoring and can even drive in multiple runs. This realization has shifted the focus in player evaluation and team building, with teams prioritizing hitters who can “slug.”
The Significance of Slugging Percentage in Modern Baseball Analytics
The advent of sabermetrics and advanced statistical analysis has cemented slugging percentage’s importance. It’s no longer just a helpful statistic; it’s a cornerstone for evaluating offensive production and its impact on winning.
Evaluating Individual Player Performance
When scouting or evaluating players, slugging percentage provides a quick and effective snapshot of a hitter’s power. It helps distinguish between a player who simply gets a lot of singles and one who is a genuine threat to hit for power. For teams looking to score runs, identifying players with high slugging percentages is a priority. This metric is crucial for:
- Identifying Power Threats: Players with consistently high SLG are the cornerstones of potent offenses.
- Assessing Run Production Potential: A higher SLG correlates with a greater ability to drive in runs.
- Understanding a Hitter’s Profile: It helps paint a picture of whether a player is a gap-to-gap hitter, a pull-power hitter, or a pure home run threat.
Team Building and Strategic Decisions
The insights gained from slugging percentage extend beyond individual player evaluation to broader team-building strategies. General managers and front office executives use SLG data to:
- Construct Lineups: Placing players with high slugging percentages in key lineup spots (e.g., 3rd, 4th, 5th) maximizes their potential impact.
- Trade Decisions: Understanding a player’s SLG can be a deciding factor in trade negotiations, as it directly relates to offensive firepower.
- Free Agent Signings: High-slugging players often command significant contracts, and their SLG is a primary justification for their value.
- Defensive Alignment: Awareness of a powerful hitter’s tendencies can influence defensive positioning.
Furthermore, in the context of modern analytics, slugging percentage is often used in conjunction with other metrics like on-base percentage (OBP) to create more comprehensive offensive evaluations. The combination of OBP and SLG is known as OPS (On-base Plus Slugging), which has become one of the most widely used all-around hitting statistics.
Historical Context and Evolution of Slugging Percentage
Slugging percentage, like many baseball statistics, has evolved in its understanding and application. While batting average has been a dominant metric since the early days of the sport, the appreciation for slugging has grown significantly over time.
The Rise of Sabermetrics and the Power Game
In the early days of baseball, the focus was heavily on batting average and runs batted in (RBIs). However, as statisticians and analysts delved deeper, the limitations of these older metrics became apparent. The development of sabermetrics, particularly through the work of individuals like Bill James, brought a more rigorous scientific approach to baseball analysis. Sabermetrics championed statistics that better reflected a player’s true contribution to winning games, and slugging percentage emerged as a key tool in this revolution.
The increasing emphasis on power hitting in modern baseball is also reflected in slugging percentages. As the game has become more analytical, teams have actively sought out players who can hit for power, leading to a greater focus on metrics like SLG. The “three true outcomes” of baseball (home runs, strikeouts, and walks) have become increasingly prevalent, and slugging percentage directly captures the value of the home run outcome.

Slugging Percentage vs. Other Power Metrics
While slugging percentage is a premier metric for power, it’s not the only one. Other relevant statistics include:
- Isolated Power (ISO): This metric isolates a player’s extra-base hitting ability by subtracting batting average from slugging percentage (ISO = SLG – BA). A higher ISO indicates a greater tendency for extra-base hits.
- Home Run Percentage (HR%): This measures the frequency of home runs relative to plate appearances or at-bats.
- Extra-Base Hit Percentage (XBH%): This calculates the proportion of hits that are doubles, triples, or home runs.
Each of these metrics offers a slightly different lens through which to view a player’s power. However, slugging percentage remains the most encompassing single statistic for quantifying overall hitting power because it incorporates all extra-base hits and provides a weighted average of bases per at-bat. Its simplicity, combined with its analytical depth, ensures its continued relevance in the ever-evolving landscape of baseball statistics.
aViewFromTheCave is a participant in the Amazon Services LLC Associates Program, an affiliate advertising program designed to provide a means for sites to earn advertising fees by advertising and linking to Amazon.com. Amazon, the Amazon logo, AmazonSupply, and the AmazonSupply logo are trademarks of Amazon.com, Inc. or its affiliates. As an Amazon Associate we earn affiliate commissions from qualifying purchases.