
In the rapidly evolving landscape of Artificial Intelligence and Machine Learning, understanding key performance metrics is paramount for evaluating and optimizing models. Among these, the Area Under the Curve (AUC) stands out as a widely adopted and robust measure, particularly for classification tasks. But what exactly is AUC, and why is it so important in the realm of technology? This article delves into the intricacies of AUC, exploring its definition, calculation, interpretation, and its critical role in the development and deployment of AI systems.
Decoding the ROC Curve: The Foundation of AUC
Before we can truly grasp AUC, we must first understand its parent concept: the Receiver Operating Characteristic (ROC) curve. The ROC curve is a graphical representation of the performance of a binary classification model at various threshold settings. It plots the True Positive Rate (TPR) against the False Positive Rate (FPR) at different classification thresholds.

Understanding the Key Components: TPR and FPR
To appreciate the ROC curve and, subsequently, AUC, it’s crucial to define its constituent rates:
-
True Positive Rate (TPR), also known as Sensitivity or Recall, measures the proportion of actual positive cases that are correctly identified by the model. It is calculated as:
$TPR = frac{TP}{TP + FN}$
Where:- $TP$ (True Positives): The number of instances correctly classified as positive.
- $FN$ (False Negatives): The number of instances incorrectly classified as negative (when they are actually positive).
-
False Positive Rate (FPR), also known as the Fall-out, measures the proportion of actual negative cases that are incorrectly identified as positive by the model. It is calculated as:
$FPR = frac{FP}{FP + TN}$
Where:- $FP$ (False Positives): The number of instances incorrectly classified as positive (when they are actually negative).
- $TN$ (True Negatives): The number of instances correctly classified as negative.
The ROC curve is generated by varying the classification threshold. For instance, a model might output a probability score for a given instance belonging to the positive class. By setting a threshold, we decide whether an instance with a score above that threshold is classified as positive or negative. As this threshold is adjusted, the TPR and FPR change, and these changes are plotted to form the ROC curve.
Visualizing Performance: The ROC Plot
The ROC plot typically has the FPR on the x-axis and the TPR on the y-axis.
- Ideal Classifier: An ideal binary classifier would have a TPR of 1 and an FPR of 0. This would manifest as a curve that goes straight up to the top-left corner of the plot.
- Random Classifier: A classifier that performs no better than random guessing would have a TPR equal to its FPR. This would result in a diagonal line from the bottom-left to the top-right corner of the plot, often referred to as the “line of no discrimination.”
The ROC curve visually depicts the trade-off between correctly identifying positive instances (TPR) and incorrectly flagging negative instances as positive (FPR). A curve that stays closer to the top-left corner indicates a better-performing model.
Calculating and Interpreting AUC
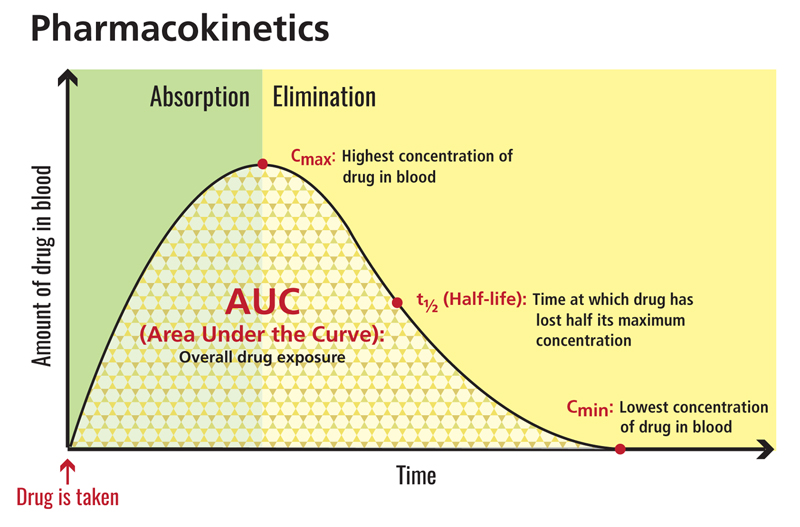
The Area Under the Curve (AUC) quantifies the overall performance of a binary classifier across all possible classification thresholds. It is essentially the area enclosed by the ROC curve and the x-axis (FPR axis).
The Mathematical Essence of AUC
While the ROC curve is a graphical representation, AUC provides a single numerical value that summarizes its performance. Mathematically, AUC can be interpreted in a probabilistic sense:
- AUC as the Probability of Ranking: AUC represents the probability that a randomly chosen positive instance will be ranked higher (assigned a higher probability score) than a randomly chosen negative instance.
This probabilistic interpretation makes AUC a particularly intuitive and powerful metric. A higher AUC value indicates that the model is better at distinguishing between positive and negative classes.
Interpreting AUC Values
The AUC score ranges from 0 to 1. Here’s a general guideline for interpreting AUC values in a machine learning context:
- AUC = 1.0: A perfect classifier. The model can perfectly distinguish between positive and negative classes.
- AUC > 0.9: Excellent classification performance.
- 0.8 < AUC <= 0.9: Very good classification performance.
- 0.7 < AUC <= 0.8: Good classification performance.
- 0.6 < AUC <= 0.7: Fair classification performance.
- 0.5 < AUC <= 0.6: Poor classification performance.
- AUC = 0.5: The classifier is no better than random guessing.
- AUC < 0.5: The classifier is performing worse than random guessing. In such cases, it’s often advisable to invert the class labels or re-evaluate the model’s approach.
It’s important to note that these thresholds are general guidelines and can vary depending on the specific domain and the acceptable risk associated with misclassifications.
Practical Calculation of AUC
In practice, AUC is not typically calculated by manually integrating the ROC curve. Machine learning libraries provide efficient functions to compute AUC directly from the predicted probabilities and the true labels of a dataset. For example, in Python’s scikit-learn library, the roc_auc_score function can be used for this purpose. This function takes the true binary labels and the predicted probabilities (or decision function values) as input and returns the AUC score.
Why AUC is a Crucial Metric in Tech
The significance of AUC in the technology sector, particularly in AI and machine learning, stems from its ability to provide a comprehensive and threshold-independent evaluation of a classifier’s performance.
Handling Imbalanced Datasets

One of the most compelling reasons for AUC’s widespread adoption is its effectiveness in evaluating models trained on imbalanced datasets. In many real-world scenarios, such as fraud detection, disease diagnosis, or anomaly detection, the number of positive instances (e.g., fraudulent transactions, diseases) is significantly smaller than the number of negative instances (e.g., legitimate transactions, healthy individuals).
In such cases, metrics like accuracy can be misleading. A model that simply predicts the majority class for all instances might achieve high accuracy but be entirely useless in identifying the rare positive cases. AUC, on the other hand, is less affected by class imbalance because it considers the entire ROC curve, which reflects the trade-off between TPR and FPR across all thresholds. It focuses on the model’s ability to rank instances correctly, irrespective of the proportion of each class.
Model Selection and Comparison
AUC serves as an invaluable tool for comparing different classification models. When evaluating multiple models for a specific task, the AUC score provides a single, consolidated metric that allows for straightforward comparison. A model with a higher AUC generally indicates superior discriminatory power. This is crucial during the model development phase, where data scientists iterate through various algorithms, feature sets, and hyperparameter configurations to find the best-performing solution.
Understanding Threshold Optimization
While AUC provides a threshold-independent view, it also informs the process of threshold selection. The ROC curve itself helps in understanding how different thresholds impact the trade-off between TPR and FPR. For instance, in a medical diagnosis scenario, a slightly higher FPR might be acceptable if it leads to a significantly higher TPR, ensuring that fewer actual positive cases are missed. The optimal threshold is often chosen based on business requirements and the cost associated with false positives and false negatives, and the ROC curve provides the visual basis for this decision.
Beyond Binary Classification: AUC in Advanced Contexts
The principles of AUC extend beyond simple binary classification. Extensions like ROC AUC for multi-class or multi-label classification problems exist, although their interpretation can become more complex. These extensions aim to generalize the concept of measuring a classifier’s ability to distinguish between classes.
Applications of AUC in Real-World Tech Scenarios
The practical utility of AUC is evident across a wide spectrum of technology applications.
Healthcare and Medical Diagnostics
In medical applications, AUC is critical for evaluating models that diagnose diseases. For example, a model predicting the likelihood of a patient having cancer. A high AUC indicates that the model can effectively differentiate between cancerous and non-cancerous patients across various probability thresholds. This is vital for early detection and treatment.
Fraud Detection and Cybersecurity
Financial institutions and cybersecurity firms heavily rely on AUC for building robust fraud detection and intrusion detection systems. These systems aim to identify anomalous activities (e.g., fraudulent transactions, cyberattacks) which are typically rare events. AUC helps assess the model’s ability to flag suspicious activities while minimizing false alarms that could disrupt legitimate operations.
E-commerce and Recommendation Systems
In e-commerce, AUC can be used to evaluate models that predict user engagement, such as the likelihood of a user clicking on an advertisement or purchasing a product. A higher AUC means the recommendation system is better at identifying users who are more likely to be interested in specific items.
Natural Language Processing (NLP) and Computer Vision
In NLP, AUC might be used to assess sentiment analysis models or spam detection. In computer vision, it can evaluate object detection or image classification models, particularly when dealing with rare object classes or subtle distinctions.
Challenges and Considerations When Using AUC
While AUC is a powerful metric, it’s not without its limitations and considerations.
Over-reliance on AUC
It’s crucial to remember that AUC is just one metric. In some situations, other metrics like precision, recall, or F1-score might provide a more nuanced understanding of model performance, especially when specific types of errors are more critical than others. For example, in a life-or-death medical scenario, minimizing false negatives (maximizing recall) might be prioritized over achieving a perfect AUC.
Misinterpretation with Extreme Imbalance
While AUC is robust to imbalance, extremely rare events or very low prediction probabilities can still pose challenges in interpretation and practical application.
Computational Cost
Calculating AUC, especially for very large datasets, can be computationally intensive. However, efficient implementations in modern libraries mitigate this concern significantly for most practical use cases.
Understanding the Domain Context
Ultimately, the interpretation and usefulness of AUC are heavily dependent on the specific domain and the business objectives. A “good” AUC score in one application might be considered mediocre in another. Therefore, understanding the context and the acceptable trade-offs is as important as the numerical value of the AUC itself.
In conclusion, the Area Under the Curve (AUC) is a fundamental and highly valuable metric in machine learning and artificial intelligence. By providing a threshold-independent measure of a binary classifier’s performance, AUC empowers developers and data scientists to build more accurate, reliable, and effective AI systems across a myriad of technological applications. Its ability to handle imbalanced data, facilitate model comparison, and inform threshold optimization makes it an indispensable tool in the ongoing advancement of AI.
aViewFromTheCave is a participant in the Amazon Services LLC Associates Program, an affiliate advertising program designed to provide a means for sites to earn advertising fees by advertising and linking to Amazon.com. Amazon, the Amazon logo, AmazonSupply, and the AmazonSupply logo are trademarks of Amazon.com, Inc. or its affiliates. As an Amazon Associate we earn affiliate commissions from qualifying purchases.