Understanding “how the stock market was today” requires more than just looking at a single number or a green or red arrow on a television screen. For the modern investor, daily market performance is a complex tapestry woven from macroeconomic data, corporate earnings, geopolitical shifts, and investor psychology. While a single day in the market is rarely a definitive indicator of long-term success, analyzing daily movements provides critical insights into the current economic climate and the underlying health of the financial system.
Decoding the Daily Pulse: Key Indices and Benchmarks
To answer how the market performed, we must first look at the major benchmarks. No single index tells the whole story, as each represents a different slice of the economy. Understanding the nuances between these indices allows investors to see where the capital is flowing and which sectors are leading or lagging.
The S&P 500: The Broader Market Indicator
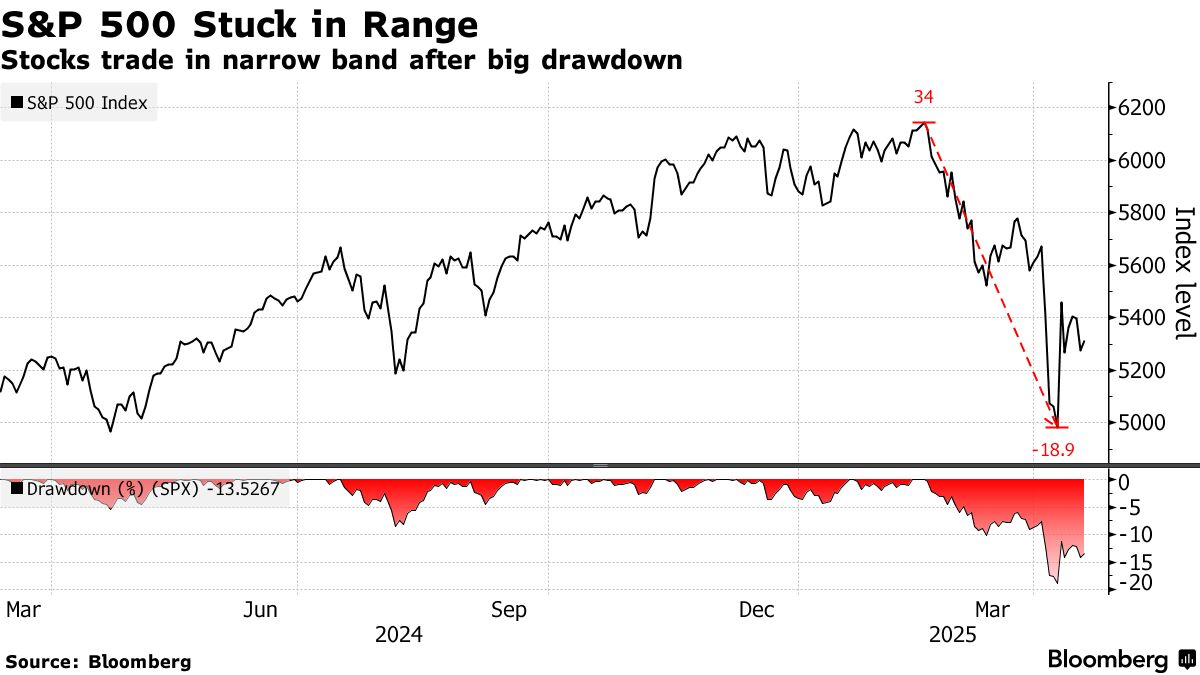
The Standard & Poor’s 500 is widely considered the most accurate reflection of the U.S. stock market. Comprising 500 of the largest publicly traded companies, it covers approximately 80% of available market capitalization. When people ask “how was the market,” they are often referring to the S&P 500. A “good” day for the S&P 500 usually suggests that the core of the American corporate engine is humming, driven by balanced growth across multiple sectors.
The Dow Jones Industrial Average: Tracking Blue-Chip Giants
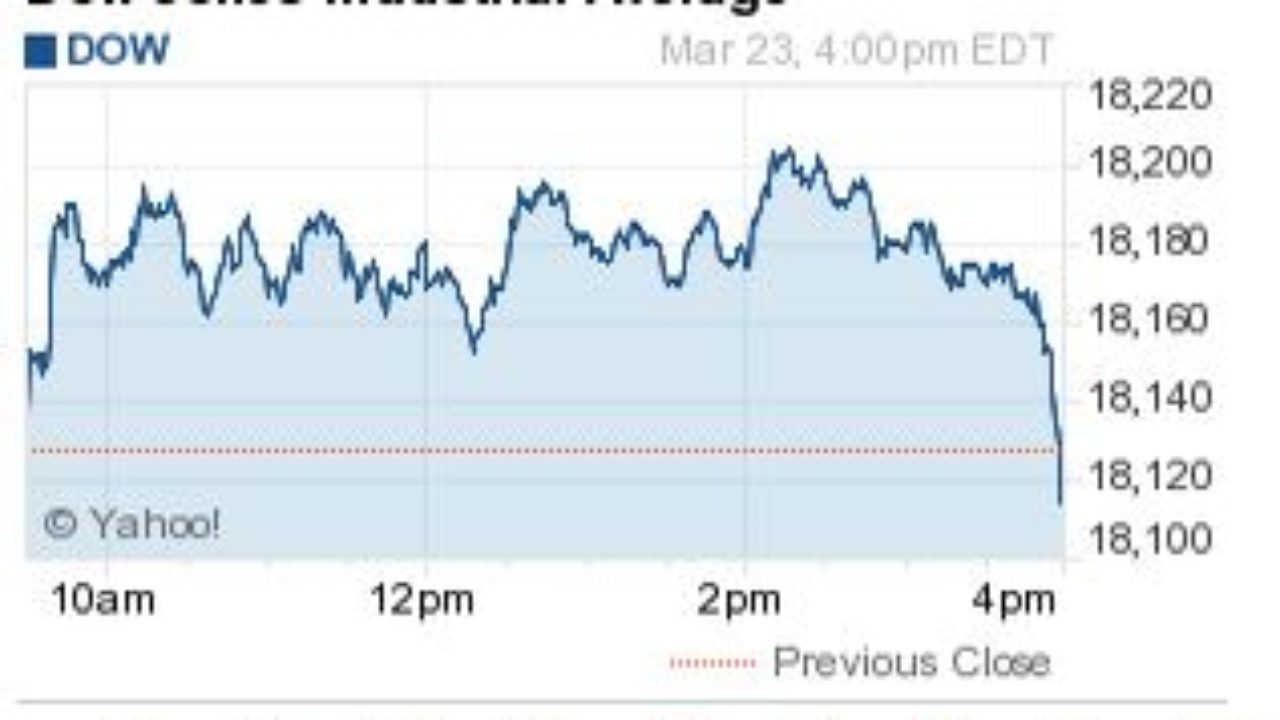
The Dow is a price-weighted index of 30 prominent companies. While it is less diverse than the S&P 500, it remains a vital psychological benchmark. Because it focuses on “Blue Chip” companies—established industry leaders like Coca-Cola, Apple, and Goldman Sachs—the Dow often reflects the sentiment of institutional stability. On days when the Dow outperforms other indices, it typically indicates a “flight to quality,” where investors favor stable, dividend-paying companies over riskier growth stocks.
The Nasdaq Composite: A Window into the Tech Sector
The Nasdaq is heavily weighted toward technology, biotechnology, and growth-oriented firms. It is often the most volatile of the major indices. On a day characterized by high innovation news or shifts in interest rate expectations, the Nasdaq will see the most significant swings. A strong day for the Nasdaq often signals high risk-appetite among investors, whereas a sharp decline may suggest concerns over valuations or rising borrowing costs.
Macroeconomic Catalysts Driving Today’s Performance
Daily fluctuations are rarely random. They are usually reactions to specific “catalysts”—data points or events that change the perceived value of future corporate cash flows. To understand today’s market, one must look at the prevailing macroeconomic narrative.
Interest Rates and the Federal Reserve’s Stance
The Federal Reserve is perhaps the single most influential force in the daily market. Investors scrutinize every word from Fed officials for clues regarding interest rate hikes or cuts. Higher interest rates increase the cost of borrowing for companies and consumers, which can slow economic growth and compress stock valuations. Conversely, a “dovish” stance—suggesting lower rates—often sends markets surging as capital becomes cheaper.
Inflation Data: CPI and PPI Reports
Inflation is the “hidden” driver of daily volatility. Reports such as the Consumer Price Index (CPI) and the Producer Price Index (PPI) are major market movers. If inflation comes in higher than expected, the market often reacts negatively, fearing that the Fed will raise rates to cool the economy. If inflation shows signs of cooling, equity markets typically rally on the hope of a “soft landing,” where inflation is controlled without triggering a recession.
Geopolitical Events and Global Market Sentiment
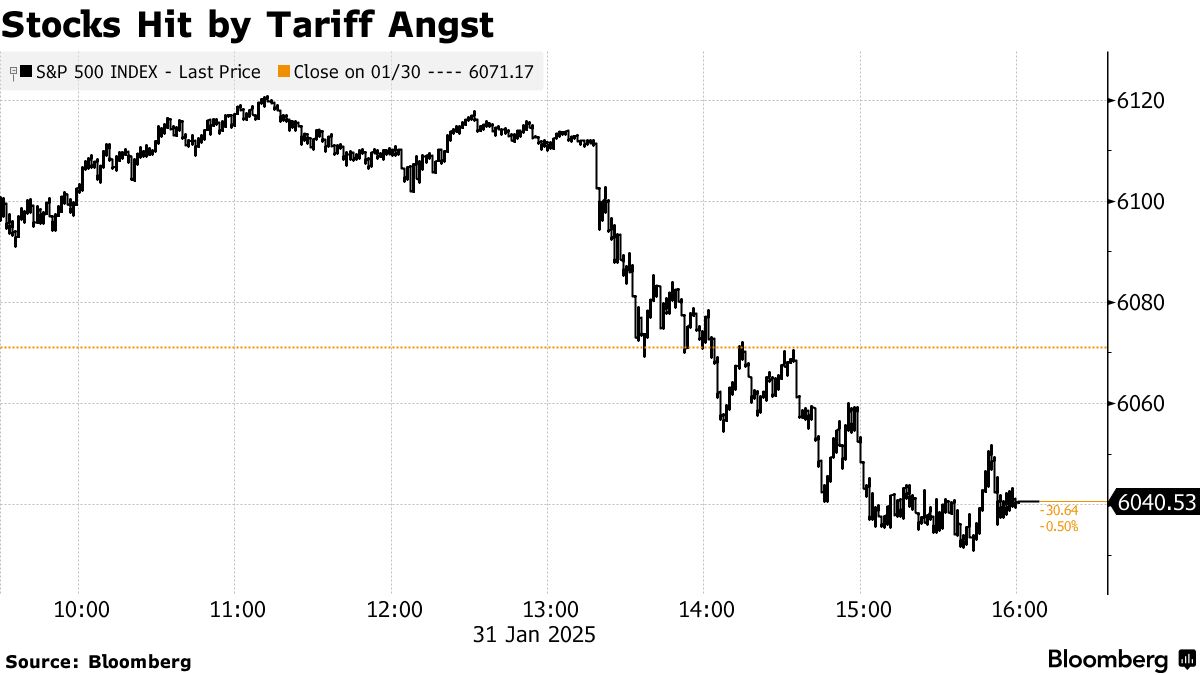
In an interconnected global economy, events far beyond Wall Street can dictate the day’s closing bell. Trade tensions, international conflicts, or shifts in foreign energy policies can create immediate ripples. For instance, a disruption in the Middle East can spike oil prices, which impacts transportation costs for retailers and disposable income for consumers, leading to a broad market sell-off. Monitoring the global landscape is essential for contextualizing domestic market behavior.
Sector Performance and the Concept of Rotation
Looking at the market as a whole can be misleading. On many days, the “headline” index might be flat, but beneath the surface, massive shifts are occurring. This is known as sector rotation, where investors move money from one area of the economy to another based on changing conditions.
Growth vs. Value: The Ongoing Tug-of-War
One of the most frequent daily narratives is the rotation between growth and value stocks. Growth stocks (often tech and discretionary) thrive when the economy is expanding and interest rates are low. Value stocks (banks, energy, industrials) often represent companies that are undervalued relative to their fundamentals. On days when economic data is stronger than expected, we often see a “rotation into value,” as investors bet on the “reopening” or strengthening of the traditional economy.
Defensive Sectors: Finding Safety in Utilities and Healthcare
When the market is “down” or volatile, savvy investors look at defensive sectors. Utilities, healthcare, and consumer staples are considered “defensive” because people need electricity, medicine, and food regardless of the economy’s state. If the S&P 500 is down but the Healthcare sector is up, it indicates a defensive posture among market participants—they are seeking shelter from uncertainty.
Energy and Commodities: The Inflation Hedge
The energy sector often moves independently of the broader tech-heavy market. Driven by crude oil and natural gas prices, energy stocks can provide a hedge against inflation. If the stock market was “mixed” today, with tech down but energy up, it often points to rising commodity prices or supply-side constraints that are benefiting energy producers at the expense of energy consumers.
Behavioral Finance: Why the Market Reacts the Way It Does
The stock market is not a cold, calculating machine; it is a collection of human decisions, often driven by emotion. Understanding the psychology behind the “daily numbers” is key to becoming a professional-level observer.
Understanding Market Sentiment and the VIX
The CBOE Volatility Index, or VIX, is often called the “Fear Gauge.” It measures the market’s expectation of 30-day volatility. If the market was down today and the VIX spiked, it indicates a high level of fear and uncertainty. If the market was down but the VIX remained low, it suggests a “controlled retreat” or profit-taking rather than a panic-driven sell-off.
The Impact of Institutional Trading and High-Frequency Algorithms
It is important to recognize that a significant portion of daily volume is driven by algorithms and institutional “program trading.” These systems can exacerbate daily moves. For example, if a major index drops below a certain “technical support level,” algorithms may trigger automatic sell orders, causing a rapid decline that isn’t necessarily based on new economic news, but rather on the mechanics of the market itself.
Long-Term Strategy in a Short-Term News Cycle
While it is natural to ask “how the market was today,” the most successful investors use this information to inform, rather than dictate, their strategy. Daily noise can often distract from the larger structural trends that drive wealth creation over decades.
Moving Beyond Daily Fluctuations
The “daily” market is often a distraction. For a long-term investor, a 1% drop in a single day is statistically insignificant. However, observing these daily movements helps investors understand the “temperature” of the market. It allows one to see which themes (AI, green energy, interest rate sensitivity) are currently in favor. The goal is to use the daily data to confirm your long-term thesis, not to change it every time the market turns red.
The Importance of Diversification and Rebalancing
A day of heavy losses in one sector serves as a powerful reminder of the importance of diversification. If your portfolio is heavily skewed toward tech and the Nasdaq has a bad day, your net worth will reflect that. By analyzing daily performance across different asset classes—including bonds, international equities, and real estate—investors can ensure their portfolio is structured to withstand the inevitable daily volatility of any single market.
In conclusion, “how the stock market was today” is a question that yields a multi-layered answer. It involves a look at the major indices, an analysis of the day’s economic reports, an observation of sector rotations, and an understanding of investor psychology. By viewing daily performance through this professional lens, you move away from reactive trading and toward an insightful, strategic approach to building and protecting your financial future.
aViewFromTheCave is a participant in the Amazon Services LLC Associates Program, an affiliate advertising program designed to provide a means for sites to earn advertising fees by advertising and linking to Amazon.com. Amazon, the Amazon logo, AmazonSupply, and the AmazonSupply logo are trademarks of Amazon.com, Inc. or its affiliates. As an Amazon Associate we earn affiliate commissions from qualifying purchases.