
The human brain, a marvel of biological engineering, remains one of the most complex and fascinating organs known to science. Understanding its intricate workings, from neural pathways to chemical signals, has long been a pursuit of researchers, clinicians, and medical professionals. In recent decades, technological advancements have revolutionized our ability to peer inside this enigmatic organ without invasive surgical procedures. Brain scans, also known as neuroimaging techniques, have emerged as indispensable tools, offering unprecedented insights into brain structure, function, and pathology. These sophisticated technologies have transformed the diagnosis and treatment of neurological disorders, propelled groundbreaking research into cognitive processes, and opened new avenues for understanding the very nature of consciousness.
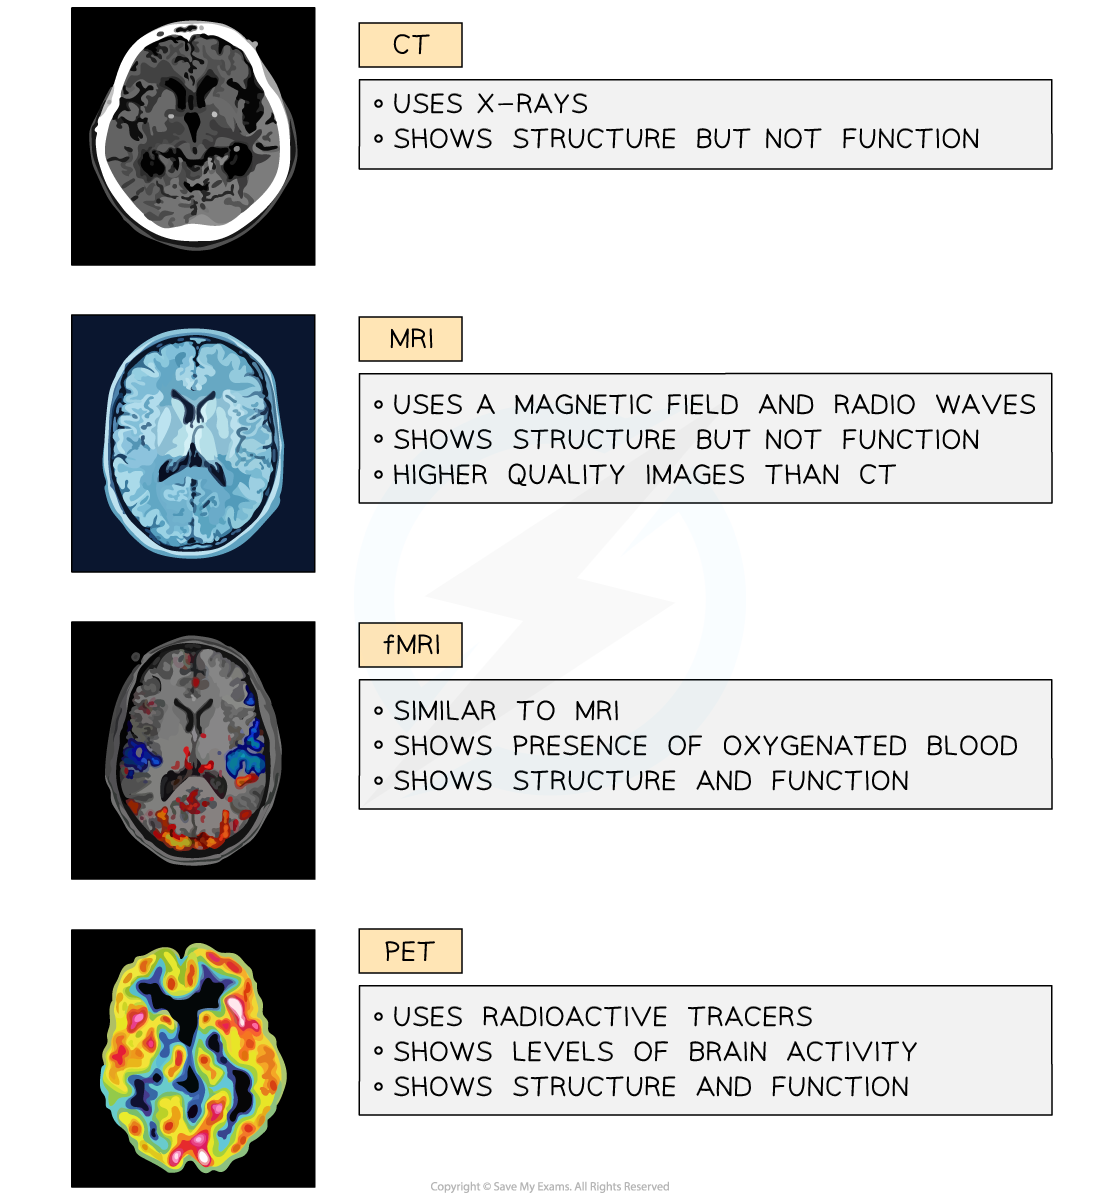
At their core, brain scans leverage various physical principles to create visual representations of the brain. From detecting subtle changes in blood flow to mapping electrical activity or visualizing anatomical details, each type of scan offers a unique perspective. This allows for a comprehensive understanding of brain health and disease, catering to specific diagnostic needs and research questions. Whether it’s identifying a tumor, assessing the damage from a stroke, studying the effects of learning, or exploring the neural basis of mental health conditions, brain scans provide the critical visual data that underpins these endeavors. This article will delve into five primary types of brain scans, exploring their underlying technologies, clinical applications, and the distinct information they provide, all through the lens of their profound impact on the technological landscape of medicine and neuroscience.
1. Magnetic Resonance Imaging (MRI) and Functional MRI (fMRI): Unveiling Structure and Activity
Magnetic Resonance Imaging (MRI) stands as a cornerstone in modern neuroimaging, renowned for its exceptional ability to generate highly detailed anatomical images of the brain. Its power lies in its non-invasive nature and its capacity to differentiate between various soft tissues with remarkable clarity, making it ideal for visualizing the intricate structures of the brain. Complementing structural MRI, Functional MRI (fMRI) takes this technology a step further by offering a dynamic view of brain activity.
High-Resolution Anatomical Imaging with MRI
The fundamental principle behind MRI involves the interaction of strong magnetic fields and radio waves with the water molecules within the body. When placed in a powerful magnetic field, the protons within hydrogen atoms in the body align themselves. Brief pulses of radiofrequency waves are then applied, which knock these aligned protons out of equilibrium. As the protons realign with the magnetic field, they emit radio signals that are detected by the MRI scanner. Different tissues, such as gray matter, white matter, cerebrospinal fluid, and bone, have varying water content and molecular compositions, which affect how their protons respond to the magnetic fields and radio waves. This differential response allows the MRI scanner to generate detailed cross-sectional images, or “slices,” of the brain.
The exquisite detail provided by MRI is crucial for identifying subtle anatomical abnormalities that might be missed by other imaging techniques. This includes the detection of tumors, the assessment of brain atrophy associated with neurodegenerative diseases like Alzheimer’s and Parkinson’s, the visualization of congenital malformations, and the evaluation of damage caused by traumatic brain injuries. Moreover, advanced MRI sequences can further enhance the visualization of specific structures, such as diffusion tensor imaging (DTI) which maps the white matter tracts, providing insights into the connectivity of brain regions and the integrity of neural pathways. This capability is invaluable for understanding conditions that affect brain connectivity, like multiple sclerosis or developmental disorders.
Mapping Brain Activity with fMRI
Functional MRI (fMRI) capitalizes on the blood-oxygen-level-dependent (BOLD) contrast mechanism. The underlying principle is that when a brain region becomes more active, it requires more oxygen. To meet this increased demand, blood flow to that area also increases, delivering oxygenated hemoglobin. Oxygenated and deoxygenated hemoglobin have different magnetic properties. Specifically, deoxygenated hemoglobin is paramagnetic, meaning it distorts the magnetic field, while oxygenated hemoglobin is diamagnetic and has a minimal effect. By detecting the subtle changes in the ratio of oxygenated to deoxygenated hemoglobin, fMRI can indirectly measure neural activity.
fMRI allows researchers and clinicians to observe which parts of the brain are active during specific cognitive tasks, such as reading, speaking, problem-solving, or even during periods of rest. This functional mapping has been instrumental in understanding the neural correlates of various cognitive processes, helping to decipher how different brain regions collaborate to perform complex functions. Clinically, fMRI can be used to map eloquent areas of the brain (those responsible for critical functions like speech and motor control) before neurosurgery, helping surgeons to avoid damaging these vital regions. It also plays a role in understanding the progression of neurological and psychiatric disorders by identifying altered patterns of brain activity. The technological sophistication of fMRI lies in its ability to capture these dynamic changes in real-time, albeit with a slight delay due to the hemodynamic response.
2. Computed Tomography (CT) Scan: Rapid Anatomical Visualization
Computed Tomography (CT) scans, often referred to as CAT scans, represent another significant technological advancement in neuroimaging, particularly valued for their speed and accessibility. While MRI offers superior soft tissue contrast, CT excels in rapidly generating cross-sectional images of the brain, making it a crucial tool in emergency settings.
How CT Scans Work
A CT scanner utilizes X-rays to create detailed images of the body. In a brain CT scan, the patient lies on a table that moves through a circular opening in the CT scanner. An X-ray tube rotates around the patient’s head, emitting a fan-shaped beam of X-rays that passes through the brain. Detectors on the opposite side of the head measure the amount of X-ray radiation that has been attenuated (absorbed or scattered) as it passed through the different tissues. Dense tissues, such as bone, absorb more X-rays, appearing brighter on the scan, while less dense tissues, like cerebrospinal fluid, absorb fewer X-rays and appear darker.
The CT scanner collects data from multiple angles around the head. A powerful computer then processes this data, using complex algorithms to reconstruct cross-sectional images, or “slices,” of the brain. These slices can be viewed in different planes (axial, sagittal, or coronal), providing a comprehensive anatomical overview. In some cases, a contrast agent, typically an iodine-based solution, is injected intravenously. This contrast agent enhances the visibility of blood vessels and certain tissues, making it easier to detect abnormalities such as tumors, aneurysms, or areas of inflammation.
Clinical Applications of CT Scans
The primary advantage of CT scans in neurology is their speed. A CT scan of the brain can typically be completed within minutes, making it the imaging modality of choice for patients presenting with acute neurological symptoms, such as sudden onset of severe headache, weakness, confusion, or loss of consciousness. In emergency departments, CT scans are indispensable for quickly identifying life-threatening conditions like intracranial hemorrhage (bleeding in the brain) caused by stroke or trauma. The ability to rapidly detect bleeding allows for prompt medical intervention, which can significantly improve patient outcomes.
CT scans are also highly effective in visualizing bone structures, making them useful for diagnosing skull fractures or identifying the presence of calcifications in the brain, which can be indicative of certain tumors or infections. While CT’s soft tissue resolution is not as good as MRI’s, it is still sufficient for detecting larger lesions such as significant tumors, large strokes, or significant brain swelling (edema). Furthermore, CT scanners are more widely available and generally less expensive than MRI scanners, making them a more accessible option in many healthcare settings, particularly in resource-limited environments or during critical emergencies where immediate diagnosis is paramount.
3. Positron Emission Tomography (PET) Scan: Revealing Metabolic Activity
Positron Emission Tomography (PET) scans offer a fundamentally different approach to neuroimaging, focusing on the metabolic and biochemical processes occurring within the brain rather than just its structure. This functional information is invaluable for understanding a wide range of neurological and psychiatric conditions at a cellular level.
The Technology Behind PET Scans
PET scans involve the use of small amounts of radioactive tracers, also known as radiopharmaceuticals. These tracers are designed to be taken up by specific cells or to participate in particular metabolic pathways. For brain PET scans, tracers like fluorodeoxyglucose (FDG), a radioactive analog of glucose, are commonly used. Glucose is the primary source of energy for brain cells. When FDG is injected into the bloodstream, it travels to the brain and is taken up by metabolically active cells.

As the radioactive isotope within the tracer decays, it emits positrons. When a positron encounters an electron in the surrounding tissue, they annihilate each other, producing two gamma rays that travel in opposite directions. The PET scanner, equipped with a ring of detectors, captures these gamma rays. By analyzing the timing and direction of these detected gamma ray pairs, the PET scanner can precisely locate where the tracer has accumulated in the brain. Areas with higher metabolic activity will have taken up more FDG and will therefore show up as “hot spots” on the PET scan, indicating increased glucose metabolism.
Applications in Diagnosis and Research
PET scans are particularly powerful in diagnosing and monitoring diseases that affect brain metabolism. For instance, in Alzheimer’s disease, characteristic patterns of reduced glucose metabolism can be detected in specific brain regions, often appearing years before significant structural changes are evident on MRI or CT scans. This early detection can be crucial for initiating treatment and planning care. Similarly, PET scans are used in the diagnosis of certain types of epilepsy, helping to pinpoint the origin of seizures by identifying areas of abnormal metabolic activity.
Furthermore, PET imaging plays a vital role in oncology, particularly for detecting and staging brain tumors. Some tumors exhibit a higher metabolic rate than surrounding healthy brain tissue, which can be visualized by PET. It is also used to assess the response of brain tumors to treatment, such as chemotherapy or radiation therapy, by observing changes in metabolic activity. Beyond clinical applications, PET scans are a cornerstone of neuroscience research, allowing scientists to study the brain’s chemical processes in vivo. This includes investigating the distribution of neurotransmitter receptors, understanding the mechanisms of addiction, exploring the neural basis of mood disorders like depression, and mapping the brain’s response to various drugs and stimuli.
4. Electroencephalography (EEG) and Magnetoencephalography (MEG): Capturing Electrical and Magnetic Activity
While MRI, CT, and PET focus on anatomical structures or metabolic processes, Electroencephalography (EEG) and Magnetoencephalography (MEG) offer direct insights into the brain’s electrical and magnetic activity, providing a temporal resolution unmatched by other neuroimaging techniques. These methods are crucial for understanding the rapid communication that occurs between neurons.
EEG: Listening to the Brain’s Electrical Symphony
EEG is a non-invasive technique that measures the electrical activity of the brain. It works by placing small, flat metal discs, called electrodes, on the scalp. These electrodes are connected to an EEG machine, which amplifies the tiny electrical signals produced by the brain’s neurons. Neurons communicate with each other through electrical impulses, and the synchronized firing of large populations of neurons creates electrical fields that can be detected on the scalp.
The EEG machine records these electrical signals as wavy lines on a monitor or paper. These patterns, known as brainwaves, vary in frequency and amplitude depending on the person’s state of consciousness, such as wakefulness, sleep, or deep thought. Different brainwave frequencies (e.g., delta, theta, alpha, beta, gamma waves) are associated with different mental states and cognitive processes.
EEG is particularly valuable for diagnosing and monitoring epilepsy, as it can detect abnormal electrical discharges that precede or accompany seizures. It is also used to assess the severity of brain damage in conditions like coma or brain death, to evaluate sleep disorders, and to investigate certain types of brain tumors or infections that may disrupt normal electrical activity. The high temporal resolution of EEG allows for the precise timing of neural events, making it ideal for studying cognitive processes that unfold rapidly, such as attention and information processing.
MEG: Mapping Magnetic Fields of the Brain
Magnetoencephalography (MEG) is another technique that measures brain activity, but instead of electrical fields, it detects the faint magnetic fields produced by the brain’s electrical currents. When neurons fire, they generate small electrical currents, and these currents, in turn, produce weak magnetic fields that extend outside the skull. MEG sensors, called magnetometers, are highly sensitive devices that can detect these magnetic fields.
MEG offers several advantages over EEG. Because magnetic fields are not distorted by the skull and scalp as much as electrical fields are, MEG can provide more precise localization of brain activity, especially for sources deep within the brain. Furthermore, MEG is less susceptible to artifacts from muscle activity, which can interfere with EEG recordings.
MEG is used to study a wide range of brain functions and disorders. It is particularly useful in epilepsy research for precisely locating the origin of seizures. It also plays a role in understanding sensory and motor processing, language comprehension, and cognitive functions. Like EEG, MEG has excellent temporal resolution, making it a powerful tool for investigating the dynamics of brain activity and the intricate timing of neural communication. The development and refinement of MEG technology have provided neuroscientists with increasingly sophisticated ways to unravel the complexities of the human brain.
5. Diffusion Tensor Imaging (DTI): Visualizing White Matter Connectivity
Diffusion Tensor Imaging (DTI) is a specialized type of Magnetic Resonance Imaging (MRI) that goes beyond simply visualizing the structure of the brain. Its unique capability lies in its ability to map the diffusion of water molecules within brain tissue, thereby revealing the organization and integrity of white matter tracts – the nerve fibers that connect different regions of the brain.
Understanding Water Diffusion in the Brain
Water molecules are in constant random motion, a process known as Brownian motion. In brain tissue, this diffusion is not entirely random; it is influenced by the physical barriers and structures present. White matter consists primarily of myelinated axons, which are long, slender projections of nerve cells that are bundled together to form tracts. The myelin sheath, a fatty insulating layer around the axons, acts as a directional guide for water diffusion. In regions of organized white matter, water molecules tend to diffuse more readily along the length of the axons than across them.
DTI exploits this directional diffusion. It uses specialized MRI sequences that measure the diffusion of water molecules in multiple directions. By analyzing how water diffuses in different directions within a voxel (a 3D pixel), DTI can determine the directionality and degree of diffusion. This information is then used to construct images that represent the white matter pathways. Key metrics derived from DTI include fractional anisotropy (FA), which quantifies the degree of directional diffusion, and mean diffusivity (MD), which measures the overall magnitude of water diffusion.

Mapping Neural Pathways and Assessing Integrity
The primary application of DTI is the visualization and analysis of white matter tracts. It allows researchers and clinicians to create detailed maps of the brain’s complex network of connections, providing insights into how different brain regions communicate with each other. This is crucial for understanding normal brain function, as well as for investigating neurological conditions that involve damage to white matter.
DTI is invaluable in diagnosing and characterizing a variety of neurological disorders. For instance, in multiple sclerosis (MS), myelin sheaths are damaged, disrupting the integrity of white matter tracts. DTI can detect these changes, even in the early stages, and help to assess the extent of the disease. Traumatic brain injury (TBI) can also cause diffuse axonal injury, which is often difficult to detect with conventional MRI. DTI can reveal subtle damage to white matter that may not be apparent on standard scans. Furthermore, DTI is used in the study of neurodegenerative diseases like Alzheimer’s and ALS, where white matter changes can occur.
In surgical planning, DTI is increasingly used to identify critical white matter pathways, such as the corticospinal tract (involved in motor control) or the arcuate fasciculus (involved in language). By mapping these pathways, neurosurgeons can better navigate the brain and avoid causing irreversible damage during surgery. The ability of DTI to non-invasively visualize and quantify the integrity of these vital neural connections represents a significant technological leap in our understanding and treatment of brain disorders.
aViewFromTheCave is a participant in the Amazon Services LLC Associates Program, an affiliate advertising program designed to provide a means for sites to earn advertising fees by advertising and linking to Amazon.com. Amazon, the Amazon logo, AmazonSupply, and the AmazonSupply logo are trademarks of Amazon.com, Inc. or its affiliates. As an Amazon Associate we earn affiliate commissions from qualifying purchases.