In the realm of data management and organization, the concepts of “column” and “row” are foundational. They represent the fundamental building blocks for structuring information, whether in a simple spreadsheet, a complex database, or a sophisticated analytical model. Understanding these terms is not merely an academic exercise; it is crucial for anyone interacting with data, from everyday users of productivity software to seasoned data scientists. This article will delve into the definitions of columns and rows, explore their significance in various technological contexts, and illustrate their practical applications.
The Fundamental Anatomy of Data Structures
At its core, data is a collection of facts, figures, and information. To make this data meaningful and actionable, it must be organized. This organization typically takes the form of a table, a grid-like structure composed of interconnected elements. Within this table, the two primary organizational components are columns and rows.
Understanding the Row: A Single Record or Observation
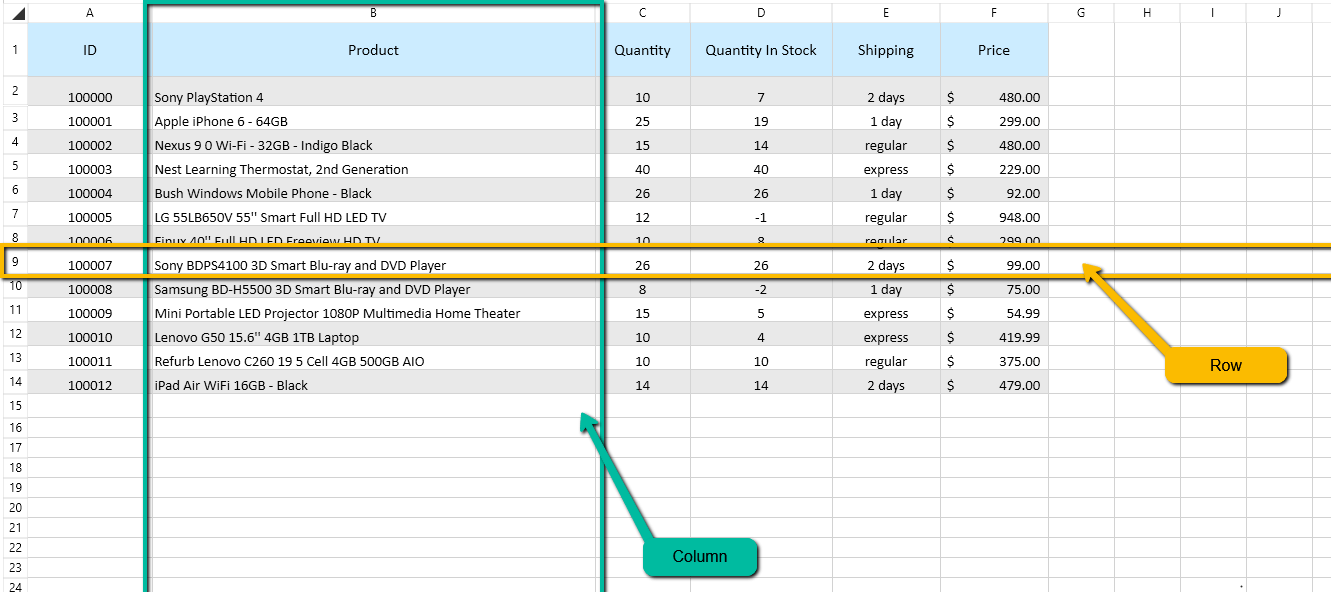
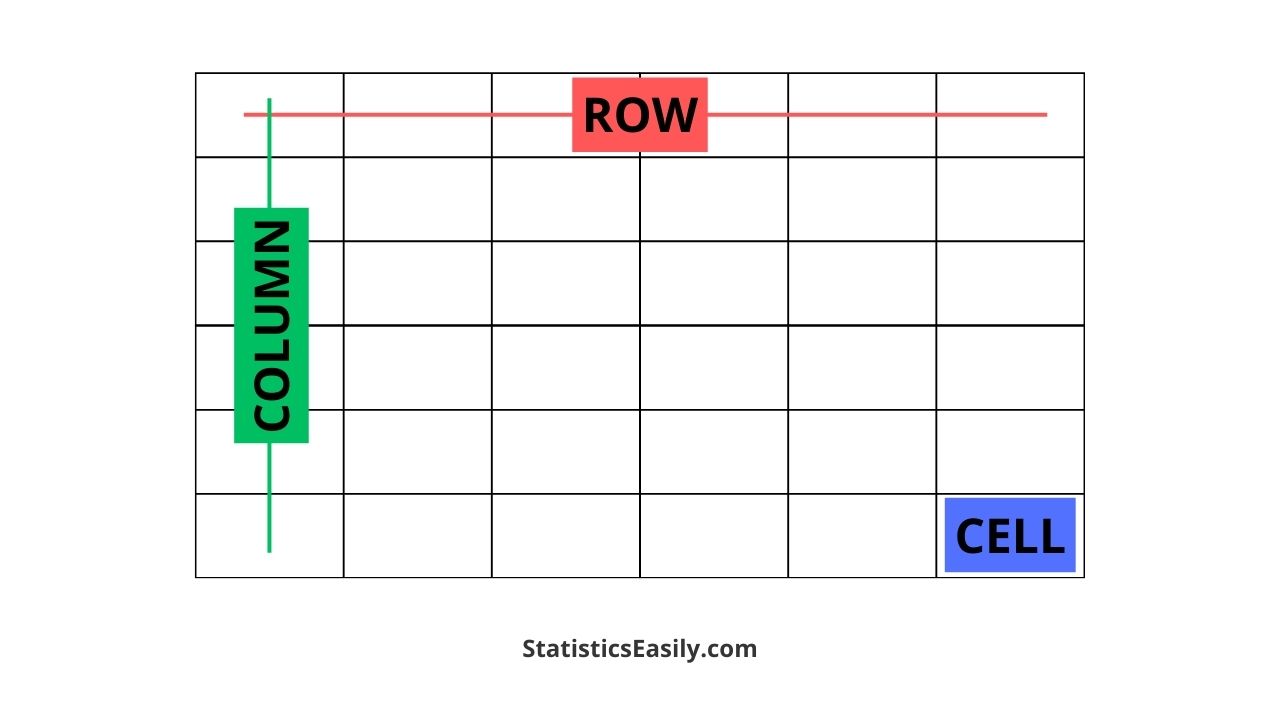
A row, often referred to as a record or an observation, represents a single, complete unit of data. In a spreadsheet, each row typically contains information pertaining to one distinct entity or event. For example, in a spreadsheet tracking customer information, a single row might contain all the details for one specific customer – their name, address, email, phone number, and purchase history.
Imagine a library catalog. Each book would likely be represented by a single row in the catalog’s database. This row would contain all the relevant attributes of that book: title, author, ISBN, publication date, genre, and location on the shelf. Similarly, in a scientific experiment, a row might represent a single measurement or observation taken at a particular time or under specific conditions.
The key characteristic of a row is its completeness. It gathers all the associated pieces of information about a singular item or event, presenting it as a unified whole. When you “scan” across a row, you are essentially getting a snapshot of one instance of what is being recorded.
Understanding the Column: A Specific Attribute or Data Type
A column, also known as a field or an attribute, represents a specific category or type of data that is consistent across all rows in a table. Each column defines a particular characteristic or property of the entities being tracked. Continuing with the customer information example, the columns might be “Customer ID,” “First Name,” “Last Name,” “Email Address,” and “Total Spent.”
In the library catalog example, the columns would be “Title,” “Author,” “ISBN,” “Publication Year,” and “Genre.” Each of these columns would contain the same type of information for every book in the catalog. The “Author” column would, for instance, contain only author names, irrespective of the book’s title or publication date.
The crucial aspect of a column is its homogeneity. All the data points within a single column share the same data type (e.g., text, numbers, dates) and represent the same kind of information. When you “look down” a column, you are examining the values of a particular attribute across all the records in your dataset. This allows for consistent analysis and comparison.
The Interplay: Building Structured Datasets
The power of columns and rows lies in their synergistic relationship. Together, they form a structured grid that allows for organized storage, retrieval, and analysis of data. This two-dimensional structure is the foundation for most digital data handling.
The Matrix of Data: Rows and Columns in Action
Consider a typical spreadsheet in Microsoft Excel or Google Sheets. Each cell within this spreadsheet is the intersection of a specific row and a specific column. This intersection point holds a single data value. For example, the cell at the intersection of the “Customer ID” column and the row corresponding to “John Smith” would contain John Smith’s unique customer ID.
This tabular format is incredibly versatile. It allows us to:
- Organize Information Logically: Grouping related data points into rows and defining consistent attributes through columns makes information easy to understand and navigate.
- Perform Calculations and Analyses: Software applications can easily operate on entire columns (e.g., calculating the average of all values in a “Sales” column) or specific rows (e.g., filtering to show all transactions for a particular customer).
- Sort and Filter Data: Users can rearrange the entire dataset based on the values in a specific column (e.g., sorting customers alphabetically by last name) or extract subsets of data based on criteria within a column (e.g., showing only customers who have spent more than $500).
- Visualize Data: Charts and graphs are often generated directly from the data arranged in rows and columns, transforming raw numbers into understandable visual representations.
Beyond Spreadsheets: Databases and Data Warehouses
While spreadsheets are a familiar entry point, the concepts of rows and columns extend to much more sophisticated data structures. Relational databases, the backbone of many modern applications, are fundamentally collections of tables. Each table in a relational database consists of rows (records) and columns (fields), just like a spreadsheet, but with added layers of complexity, relationships between tables, and advanced querying capabilities.
In a database context:
- Rows are often referred to as tuples.
- Columns are known as attributes or fields.
Data warehouses, designed for large-scale analytics and reporting, also rely on these fundamental structures. They organize vast amounts of data into tables, where rows represent individual transactions or events, and columns represent the various attributes associated with those events. The ability to efficiently query and aggregate data across millions of rows and hundreds of columns is what makes data warehouses so powerful for business intelligence.
Practical Applications in the Tech Landscape
The understanding and manipulation of rows and columns are pervasive in the technology sector. From the software we use daily to the complex systems that power the internet, these concepts are implicitly or explicitly at play.
Software and Applications: The Ubiquitous Table
Virtually every application that deals with structured information will, at some level, utilize the concept of rows and columns.
- Productivity Suites: As mentioned, spreadsheet software like Microsoft Excel, Google Sheets, and Apple Numbers are direct implementations of row-and-column-based data organization. Word processors also offer table functionalities that adhere to these principles.
- Database Management Systems (DBMS): Software like SQL Server, MySQL, PostgreSQL, and Oracle are built around managing relational tables composed of rows and columns. Developers and database administrators constantly work with these structures to design, populate, and query data.
- Customer Relationship Management (CRM) Systems: CRMs, such as Salesforce or HubSpot, organize customer data into tables where each row represents a customer or a lead, and columns define their attributes (contact information, interaction history, sales pipeline stage).
- Enterprise Resource Planning (ERP) Systems: ERP systems, which manage core business processes, use tables extensively to track inventory, financial transactions, human resources data, and more.
- Web Development: When displaying lists of products, users, or articles on a website, developers are essentially rendering data organized in rows and columns, often fetched from databases.
Data Analysis and Visualization: Unlocking Insights
The power of data analysis is unlocked by the ability to process and interpret information structured by rows and columns.
- Data Scientists and Analysts: These professionals spend a significant portion of their time cleaning, transforming, and analyzing datasets structured in tabular form. They write queries to select specific rows and columns, apply mathematical functions to column data, and create models based on these relationships.
- Business Intelligence (BI) Tools: Tools like Tableau, Power BI, and Qlik Sense are designed to connect to data sources and present information visually, often by mapping columns to axes, colors, or sizes in charts and graphs, and using rows to represent individual data points.
- Machine Learning: Many machine learning algorithms operate on data represented as feature vectors, which can be conceptually understood as rows in a dataset, where each column represents a feature or a predictor variable.
Programming and Scripting: Manipulating Data Programmatically
In programming, the ability to work with collections of data that mimic rows and columns is essential.
- Arrays and Lists: In many programming languages, arrays and lists are used to store sequences of data. A two-dimensional array can be thought of as a grid of rows and columns, where each element is accessed by its row and column index.
- DataFrames: Libraries like Pandas in Python and dplyr in R provide powerful data structures called DataFrames, which are essentially in-memory tables offering extensive functionalities for manipulating rows and columns. These are indispensable for data wrangling and analysis.
- APIs (Application Programming Interfaces): When applications communicate with each other, data is often exchanged in structured formats like JSON or XML. These formats, while not strictly tabular, can often be parsed into row-and-column-like structures for processing.
Navigating Data: Best Practices and Considerations
While the concepts of rows and columns are straightforward, effective data management requires attention to detail and adherence to certain best practices.
Data Integrity and Consistency
Ensuring the integrity and consistency of data within rows and columns is paramount.
- Data Types: Each column should have a clearly defined data type (e.g., integer, string, date, boolean). Mismatched data types within a column can lead to errors during analysis and processing. For example, attempting to perform mathematical operations on a column containing text strings will likely fail.
- Uniqueness: In many cases, a column or a combination of columns is designated as a “primary key” to uniquely identify each row. This prevents duplicate records and ensures data accuracy.
- Null Values: Understanding how to handle missing data points (often represented as “NULL” or blank) within cells is crucial. Strategies for dealing with missing values, such as imputation or exclusion, can significantly impact analytical outcomes.
Efficient Data Handling
As datasets grow larger, efficient handling of rows and columns becomes critical for performance.
- Indexing: In databases, indexes are created on columns to speed up data retrieval. Without indexes, searching for specific rows based on column values can be extremely slow, especially in large tables.
- Data Normalization: In relational database design, normalization is a process of organizing columns and tables to reduce data redundancy and improve data integrity. This often involves splitting large tables into smaller, related ones.
- Columnar Storage: For analytical workloads, some databases and data warehousing solutions utilize columnar storage formats. Instead of storing data row by row, data is stored column by column. This can significantly improve query performance when analyzing specific columns across a large number of rows, as only the required columns need to be read from disk.

The Importance of Labels and Metadata
Clear labeling of rows and columns is essential for interpretability.
- Meaningful Names: Column names should be descriptive and unambiguous, clearly indicating the type of data they contain. Instead of a generic name like “Val,” use “SaleAmount” or “CustomerAge.”
- Metadata: Beyond the data itself, metadata (data about the data) provides crucial context. This can include descriptions of columns, units of measurement, data sources, and the date the data was last updated.
In conclusion, the seemingly simple concepts of “row” and “column” are the bedrock of data organization and manipulation in the technological landscape. From the spreadsheets on our desktops to the vast databases powering global services, understanding these fundamental units is key to effectively managing, analyzing, and extracting value from the ever-increasing volume of digital information. They are the universal language of structured data, enabling us to make sense of complexity and drive informed decisions in an increasingly data-centric world.
aViewFromTheCave is a participant in the Amazon Services LLC Associates Program, an affiliate advertising program designed to provide a means for sites to earn advertising fees by advertising and linking to Amazon.com. Amazon, the Amazon logo, AmazonSupply, and the AmazonSupply logo are trademarks of Amazon.com, Inc. or its affiliates. As an Amazon Associate we earn affiliate commissions from qualifying purchases.