
The question “What is the DJIA today?” is perhaps the most common query in the world of finance. Whether you are a seasoned institutional trader, a retail investor managing a 401(k), or a casual observer of the evening news, the Dow Jones Industrial Average (DJIA) serves as the primary shorthand for the health of the American economy. However, the numerical value of the Dow at any given moment—be it 35,000 or 40,000—is only the surface of a much deeper financial story.
To truly understand what the DJIA is today, one must look beyond the flashing red and green numbers on a ticker tape. We must examine its unique weighting methodology, the blue-chip giants that comprise its ranks, and the macroeconomic forces that cause it to fluctuate. In an era of high-frequency trading and complex financial derivatives, the Dow remains a foundational pillar of market sentiment and a critical tool for personal wealth management.

The Mechanics of the Dow: How the Index is Calculated
The DJIA is unique among major stock indices due to its methodology. Unlike the S&P 500 or the Nasdaq Composite, which are market-capitalization-weighted, the Dow is a price-weighted index. This means that companies with higher stock prices have a greater influence on the index’s movement than those with lower stock prices, regardless of the company’s actual total size or market value.
The Price-Weighting Phenomenon
In a price-weighted system, a $1 move in a stock trading at $200 has the same impact on the index as a $1 move in a stock trading at $50. However, a percentage-based move in the more expensive stock will swing the Dow much more significantly. This has led to historical criticisms, as a company like UnitedHealth Group (which often carries a high share price) can exert more influence over the “Dow points” than a massive company like Apple if Apple’s share price is lower due to stock splits. For the modern investor, understanding this quirk is essential for interpreting why the Dow might be “down” even if the broader market feels stable.
The Role of the Dow Divisor
You might wonder how 30 stocks with prices ranging from $50 to $500 can result in an index value in the tens of thousands. The answer lies in the “Dow Divisor.” Originally, the index was a simple average—the sum of the prices divided by the number of stocks. However, to account for stock splits, dividends, and corporate spin-offs, the Wall Street Journal editors (who maintain the index) use a mathematical constant called the divisor. Today, the divisor is a fraction much smaller than one, which acts as a multiplier. This ensures that a stock split doesn’t cause a massive, artificial “drop” in the index level, maintaining historical continuity.
Selection Criteria for the “Blue Chips”
The DJIA is comprised of 30 “blue-chip” companies. There is no rigid formula for inclusion; instead, a committee selects companies that have an excellent reputation, demonstrate sustained growth, and represent a broad cross-section of the U.S. economy. Because there are only 30 slots, the composition changes over time to reflect the shifting landscape of American industry. For example, the removal of old-guard industrial giants in favor of tech and healthcare leaders illustrates the transition from a manufacturing-based economy to a service- and technology-driven one.
Economic Drivers: What Moves the DJIA Today?
When you check the DJIA today and see a massive gain or a steep decline, several macroeconomic factors are likely at play. Because the Dow represents the titans of industry—companies with massive workforces and global footprints—it is highly sensitive to the broader economic climate.
Interest Rates and Federal Reserve Policy
Perhaps the most significant driver of the DJIA in the current era is the Federal Reserve’s monetary policy. When the Fed raises interest rates to combat inflation, borrowing costs for corporations increase, and the “discount rate” used to value future earnings rises. This typically puts downward pressure on the Dow. Conversely, when the Fed signals a “pivot” toward lowering rates, the Dow often rallies as investors anticipate cheaper capital and stronger consumer spending. Today’s investors watch the Federal Reserve’s Federal Open Market Committee (FOMC) meetings with more intensity than almost any other event.
Corporate Earnings Season
Four times a year, the companies within the DJIA report their quarterly financial results. Because the Dow is so concentrated, a “miss” or a “beat” by just two or three heavyweights (such as Goldman Sachs or Microsoft) can dictate the direction of the entire index for the day. Investors look specifically at revenue growth, profit margins, and, most importantly, “forward guidance.” If the 30 companies of the Dow collectively suggest that consumer demand is softening, the index will react long before that softness shows up in official government data.

Geopolitical Stability and Trade
The components of the DJIA are multinational corporations. They rely on global supply chains and international markets for a significant portion of their revenue. Consequently, the Dow is a barometer for geopolitical health. Trade tensions, international conflicts, or fluctuations in the value of the U.S. Dollar can all trigger volatility. When the Dollar is strong, the international earnings of Dow companies are worth less when converted back into USD, which can act as a headwind for the index even if the companies are performing well operationally.
The Dow as an Investment Benchmark
While many people look at the DJIA to see “how the market is doing,” savvy investors use it as a benchmark for their own portfolios. Understanding the Dow’s performance helps individuals determine if their personal investment strategy is keeping pace with the titans of the American economy.
Investing via Index Funds and ETFs
You cannot “buy” the DJIA directly because it is a mathematical index, not a tradable asset. However, the rise of Exchange-Traded Funds (ETFs) has made it easy for anyone to mirror its performance. The most famous example is the SPDR Dow Jones Industrial Average ETF Trust (Ticker: DIA), often referred to as “Diamonds.” By purchasing shares of this ETF, an investor gains exposure to all 30 companies in the index in their exact proportions. This is a popular strategy for those seeking “Value” and “Income,” as Dow companies are typically mature and frequently pay dividends.
Comparing the Dow to Other Indices
Is the DJIA the best measure of your wealth? Not necessarily. Because it only tracks 30 stocks, it is much less diversified than the S&P 500 (500 stocks) or the Russell 2000 (small-cap stocks). During periods where technology is booming, the Nasdaq might soar while the Dow stays flat. Conversely, during economic downturns, the Dow often proves more resilient because its components are “defensive” companies with deep pockets. Investors should use the DJIA today as one piece of a larger puzzle, comparing it against other benchmarks to get a full picture of market breadth.
Psychological Impact and Market Sentiment
The DJIA holds a psychological power that other indices lack. When the Dow hits a “milestone” (like 30,000 or 40,000), it generates headlines that influence consumer confidence. For the average person, a “1,000-point drop” sounds catastrophic, even if it only represents a 2.5% decline in percentage terms. Understanding the difference between points and percentages is crucial for maintaining emotional discipline in investing. Seeing the Dow today as a percentage of its total value, rather than just a raw number, helps prevent panic-selling during routine market corrections.
Navigating Volatility: Long-Term Trends vs. Daily Noise
In the age of 24-hour news cycles, it is easy to become obsessed with what the DJIA is doing “today.” However, successful financial planning requires the ability to distinguish between daily noise and long-term secular trends.
The Power of Dividends and Reinvestment
One of the most overlooked aspects of the DJIA is the dividend yield of its components. Many Dow companies, such as Coca-Cola, Procter & Gamble, and Johnson & Johnson, are “Dividend Aristocrats”—companies that have increased their payouts for decades. When you look at the “Price Return” of the Dow today, you are only seeing half the story. The “Total Return,” which includes reinvested dividends, is significantly higher over long periods. For the long-term investor, a flat day in the Dow is still a winning day if they are collecting yield from these 30 industrial pillars.
Analyzing “Point” Volatility in Context
Volatility is a natural part of the market cycle. It is important to remember that as the index grows in value, the “point” swings will naturally become larger. A 500-point swing today is far less significant than a 500-point swing was in 1987 or 2008. By focusing on percentage changes and the underlying economic reasons for volatility, investors can avoid the trap of “recency bias”—the tendency to believe that the current trend will continue indefinitely.
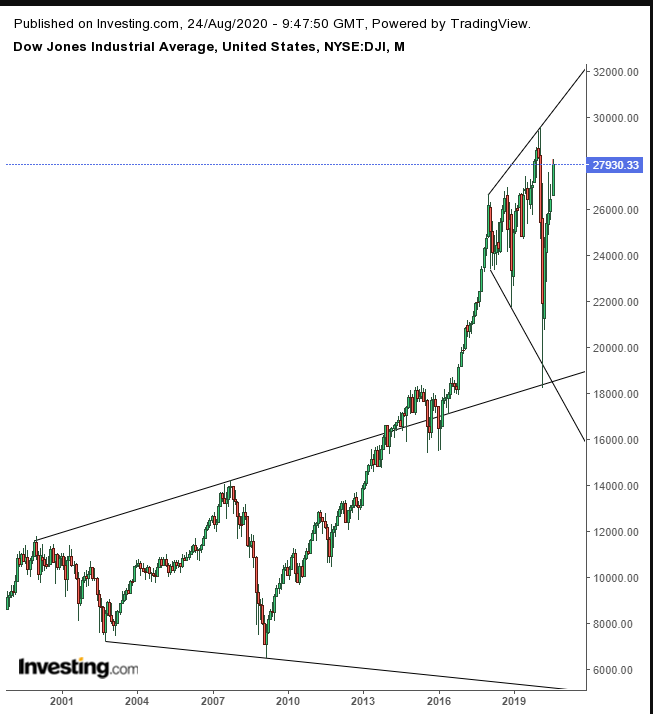
Using the Dow for Tactical Asset Allocation
Finally, the DJIA today serves as a guide for tactical moves. If the Dow is significantly outperforming tech-heavy indices, it may signal a “rotation” into value stocks and cyclical sectors like financials and industrials. If the Dow is lagging, it might suggest that investors are seeking high-growth opportunities elsewhere. By watching these rotations, business owners and investors can adjust their cash reserves, retirement contributions, and risk tolerance to better align with the current market environment.
In conclusion, “What is the DJIA today?” is a question that opens the door to a complex world of finance. It is a reflection of 30 of the world’s most powerful corporations, a mathematical result of a century-old weighting system, and a mirror of global economic sentiment. Whether the Dow is up or down today, its value lies in its history and its ability to provide a snapshot of the enduring strength of the American corporate engine. For those focused on building long-term wealth, the Dow is not just a number to be checked; it is a narrative to be understood.
aViewFromTheCave is a participant in the Amazon Services LLC Associates Program, an affiliate advertising program designed to provide a means for sites to earn advertising fees by advertising and linking to Amazon.com. Amazon, the Amazon logo, AmazonSupply, and the AmazonSupply logo are trademarks of Amazon.com, Inc. or its affiliates. As an Amazon Associate we earn affiliate commissions from qualifying purchases.