In the realm of finance, numbers are the language of progress, risk, and stability. Among the various mathematical tools available to investors, business owners, and personal finance enthusiasts, the concept of percentage decrease stands as one of the most critical metrics for assessing performance and risk. Whether you are tracking a dip in the stock market, calculating the depreciation of an asset, or identifying areas to cut corporate overhead, understanding how to calculate and interpret a percentage decrease is non-negotiable.
Percentage decrease is more than just a subtraction exercise; it is a relative measure that provides context to data. A $500 drop in value means something entirely different if the original investment was $1,000 versus $100,000. By mastering this calculation, financial stakeholders can make informed decisions based on the magnitude of change rather than just the raw figures.

The Fundamental Mechanics of Percentage Decrease in Finance
Before diving into complex financial models, one must have a rock-solid grasp of the underlying arithmetic. Percentage decrease measures the relationship between a starting value and a lower subsequent value, expressed as a fraction of one hundred. In a financial context, this allows for a standardized comparison across different asset classes and timeframes.
The Core Formula Explained
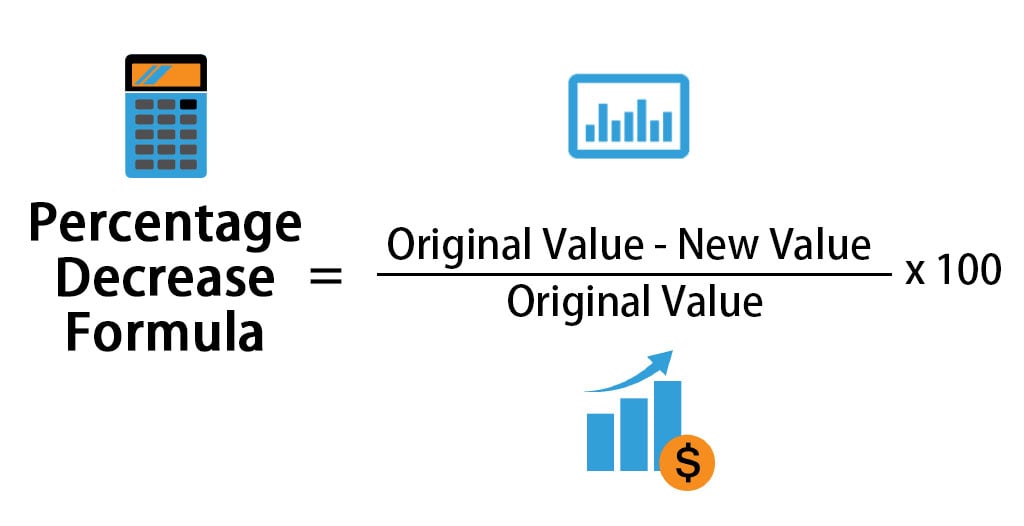
The mathematical formula for percentage decrease is straightforward but requires precision. To find the percentage decrease, you follow this structure:
Percentage Decrease = [(Original Value – New Value) / Original Value] × 100
In financial reporting, the “Original Value” is often referred to as the “Base” or “Initial Principal,” while the “New Value” represents the current market price or the ending balance of a period. The numerator (Original Value minus New Value) represents the absolute decrease. By dividing this absolute decrease by the original value, you determine the “rate” of the decline. Multiplying by 100 converts that decimal into a percentage, making it digestible for reports and stakeholders.
A Step-by-Step Calculation Guide for Investors
To apply this in a real-world scenario, imagine an investor who purchased shares in a fintech company at $150 per share. Following a quarterly earnings report that missed expectations, the stock price drops to $120. To calculate the percentage decrease:
- Identify the values: Original Value = $150; New Value = $120.
- Find the absolute difference: $150 – $120 = $30.
- Divide by the original value: $30 / $150 = 0.2.
- Convert to a percentage: 0.2 × 100 = 20%.
The stock has experienced a 20% decrease. For a money manager, this 20% figure is a “signal” that might trigger a stop-loss order or a re-evaluation of the company’s fundamentals. Without the percentage context, a $30 drop might seem manageable or catastrophic; the percentage provides the scale necessary for disciplined decision-making.
Percentage Decrease in Investment Analysis and Risk Management
For seasoned investors, the percentage decrease is the primary metric for measuring “drawdowns”—the peak-to-trough decline during a specific period for an investment or portfolio. Understanding these figures is essential for risk tolerance assessment and long-term wealth preservation.
Tracking Portfolio Volatility and Drawdowns
Volatility is the heartbeat of the financial markets, and percentage decrease is the tool we use to measure its downward pulse. In a diversified portfolio, different assets will experience varying degrees of percentage decrease during a market correction. For instance, during a recession, growth stocks might see a 30% decrease, while government bonds might only see a 2% decrease.
Monitoring these percentages allows an investor to understand their “Maximum Drawdown” (MDD). The MDD is the maximum observed loss from a peak to a trough of a portfolio, before a new peak is attained. If an investor knows their portfolio has a historical maximum drawdown of 15%, they can mentally and financially prepare for future volatility. If the percentage decrease exceeds this historical norm, it may indicate a fundamental shift in the market or an error in asset allocation.
Understanding the “Math of Recovery”
One of the most profound lessons in financial literacy is the asymmetry of percentage changes. A common mistake made by novice investors is assuming that if an asset decreases by 50%, a 50% gain will bring them back to “even.” This is a mathematical fallacy that can lead to poor financial planning.
If a $10,000 investment suffers a 50% decrease, it is now worth $5,000. To return to the original $10,000, the investment must gain $5,000. However, $5,000 is 100% of the current $5,000 value. Therefore, a 50% loss requires a 100% gain just to break even.
This “Math of Recovery” highlights why minimizing percentage decreases (losses) is often more important than chasing high percentage increases (gains). Capital preservation is the cornerstone of compound interest; the larger the percentage decrease, the exponentially harder the “New Value” must work to recover the “Original Value.”
Strategic Business Finance: Leveraging Percentage Decrease for Growth
In a corporate environment, percentage decrease is not always a sign of failure. When applied to costs, liabilities, and inefficiencies, a high percentage decrease is a primary objective. CFOs and business analysts use these metrics to track the success of lean initiatives and operational improvements.
Cost Optimization and Expense Reduction
For a business to increase its profit margins, it must either increase revenue or decrease expenses. Strategic expense reduction is often tracked through percentage decrease metrics. If a manufacturing firm implements a new AI-driven supply chain tool that reduces waste from $50,000 a month to $35,000, they have achieved a 30% decrease in waste costs.
This 30% reduction directly impacts the bottom line, often more efficiently than an equivalent increase in sales would. Because sales involve “cost of goods sold,” a 30% increase in revenue does not equal a 30% increase in profit. However, a 30% decrease in a fixed expense often translates directly into higher net income. This is why financial analysts scrutinize “Year-over-Year” (YoY) percentage decreases in operational expenses as a sign of a well-managed, maturing company.
Analyzing Market Share Shifts and Competitive Landscape
Percentage decrease is also a vital indicator of market health and competitive positioning. If a dominant player in the smartphone industry sees its market share drop from 40% to 32%, that is a 20% decrease in market share.
While the 8-point drop might seem small in isolation, the 20% relative decrease signals a major shift in consumer preference or a successful disruption by a competitor. Businesses use these percentages to pivot their strategies, reallocate marketing budgets, or initiate product R&D to stem the decline. In this context, the percentage decrease acts as an early warning system for corporate sustainability.
Practical Applications in Personal Finance and Budgeting
Beyond the stock market and corporate boardrooms, the ability to calculate percentage decrease is a fundamental skill for everyday financial health. From navigating the grocery store to managing long-term debt, this metric helps individuals maintain their purchasing power.
Navigating Inflation and Purchasing Power
Inflation is essentially a percentage decrease in the purchasing power of money. If inflation is at 5% per year, the “value” of a dollar has decreased by roughly that amount in terms of what it can buy. Understanding this allows individuals to adjust their savings goals. If your high-yield savings account offers a 4% interest rate, but inflation is causing a 5% decrease in currency value, you are effectively losing 1% of your purchasing power annually.
By recognizing this percentage decrease, a savvy consumer knows they must find investment vehicles that outperform the rate of inflation to truly grow their wealth. It shifts the perspective from “nominal value” (the number on the bill) to “real value” (what the bill can actually purchase).
Debt Reduction Strategies and Interest Impact
For those working toward financial freedom, tracking the percentage decrease of their total debt is a powerful motivator. Using the “debt snowball” or “debt avalanche” methods, individuals can calculate the month-over-month percentage decrease in their liabilities.
For example, if a household has $20,000 in credit card debt and reduces it to $15,000 over six months, they have achieved a 25% decrease in their debt burden. Seeing that “25% gone” is often more psychologically rewarding than simply seeing the raw dollar amount change. Furthermore, decreasing the principal balance results in a subsequent percentage decrease in interest charges incurred each month, creating a positive feedback loop that accelerates the journey toward zero debt.
Conclusion: Mastering the Metric for Financial Literacy
The ability to calculate and interpret percentage decrease is a cornerstone of financial literacy. It provides the necessary scale to evaluate investment losses, the strategic insight to optimize business operations, and the clarity to manage personal budgets effectively. In the world of money, those who only look at absolute numbers are often blindsided by the underlying trends.
By viewing every financial shift through the lens of percentage change, you gain a deeper understanding of the “Math of Recovery” and the true impact of inflation and interest. Whether you are a professional analyst or someone simply looking to better manage their household income, mastering the percentage decrease is an investment in your own financial intelligence that pays dividends in every decision you make.
aViewFromTheCave is a participant in the Amazon Services LLC Associates Program, an affiliate advertising program designed to provide a means for sites to earn advertising fees by advertising and linking to Amazon.com. Amazon, the Amazon logo, AmazonSupply, and the AmazonSupply logo are trademarks of Amazon.com, Inc. or its affiliates. As an Amazon Associate we earn affiliate commissions from qualifying purchases.