In the dynamic world of finance, where numbers tell the story of success, struggle, and opportunity, understanding the relationship between different data points is paramount. One of the most fundamental and widely used metrics to decipher this relationship is the “percentage of change.” Far from being a mere academic exercise, this calculation serves as a cornerstone for financial analysis, investment decisions, business strategy, and personal budgeting. It allows us to quantify growth, decline, and volatility, providing critical context that absolute numbers often lack. Without it, financial trends remain obscured, and informed decision-making becomes a shot in the dark.
This article delves into the essence of percentage change, exploring its calculation, its profound significance in various financial contexts, practical applications, and common pitfalls to avoid. Whether you’re a seasoned investor, a budding entrepreneur, a meticulous budgeter, or simply someone looking to make sense of economic news, mastering this concept will undoubtedly sharpen your financial acumen.
Unpacking the Core Concept: The Formula and Its Foundation
At its heart, the percentage of change is a simple yet powerful mathematical tool designed to express the relative difference between an old (or initial) value and a new (or final) value as a percentage. It answers the crucial question: “By what proportion has something increased or decreased relative to its starting point?”
The Universal Formula Explained
The formula for calculating the percentage of change is straightforward and universally applicable:
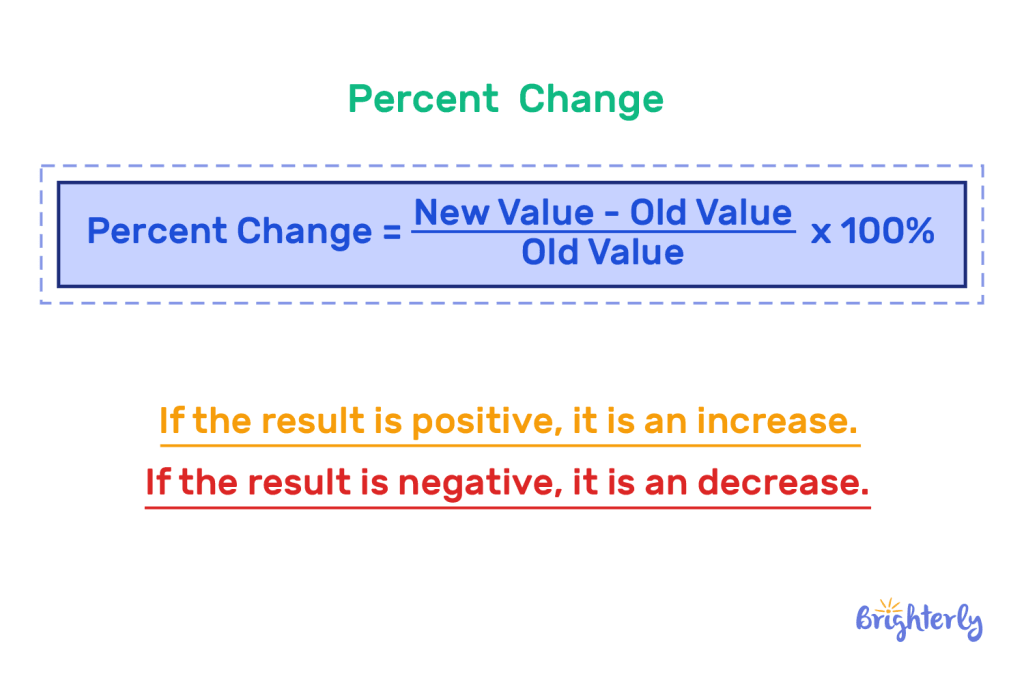
Percentage Change = [ (New Value – Old Value) / Old Value ] * 100
Let’s break down each component:
- New Value (or Final Value): This is the more recent or updated number you are comparing.
- Old Value (or Initial Value): This is the original or starting number against which you are measuring the change.
- Difference (New Value – Old Value): This first step calculates the absolute numerical increase or decrease. A positive result indicates an increase, while a negative result indicates a decrease.
- Dividing by Old Value: This step is crucial. By dividing the absolute difference by the original value, you normalize the change, expressing it as a fraction or ratio relative to the starting point. This normalization is what makes the percentage change so valuable, as it allows for meaningful comparisons across different scales.
- Multiplying by 100: Finally, multiplying the result by 100 converts the decimal or fractional ratio into a percentage, making it easier to interpret and communicate.
For example, if an investment grew from $100 (Old Value) to $120 (New Value):
Percentage Change = [ ($120 – $100) / $100 ] * 100
= [ $20 / $100 ] * 100
= 0.20 * 100
= 20% (an increase)
If an asset depreciated from $500 to $450:
Percentage Change = [ ($450 – $500) / $500 ] * 100
= [ -$50 / $500 ] * 100
= -0.10 * 100
= -10% (a decrease)
Absolute vs. Relative Change: Why Context Matters
It’s vital to distinguish between absolute change and relative (percentage) change.
- Absolute Change simply tells you the raw numerical difference between two numbers (New Value – Old Value). For instance, an investment increasing by $100 is an absolute change.
- Relative Change (Percentage Change) provides context. If that $100 increase came from an initial $1,000 investment, it’s a 10% gain. If it came from an initial $100 investment, it’s a 100% gain. The absolute change is the same ($100), but the relative impact and significance are vastly different.
In finance, relative change is almost always preferred because it standardizes comparisons. A $1,000 profit might sound good, but if it came from a $1,000,000 portfolio, it’s a paltry 0.1% return. If it came from a $5,000 portfolio, it’s a stellar 20% return. The percentage change provides the true measure of performance and impact.
Why Percentage Change is Indispensable in Financial Analysis
The utility of percentage change in the money domain cannot be overstated. It’s the language analysts, investors, and businesses speak to convey performance, risk, and opportunity.
Tracking Investment Performance and Returns
For investors, percentage change is the primary metric for evaluating the success or failure of their portfolio and individual assets.
- Portfolio Growth: Investors routinely calculate the percentage change in their portfolio’s value over various periods (daily, monthly, annually) to assess overall performance against benchmarks or personal goals. A 15% annual return provides a clear understanding of growth, regardless of the initial investment size.
- Individual Stock/Asset Performance: When comparing stocks, mutual funds, or other investment vehicles, percentage gain or loss is far more informative than absolute dollar amounts. A stock moving from $10 to $12 represents a 20% gain, while another moving from $100 to $102 is only a 2% gain. The former, despite a smaller absolute dollar increase, demonstrates higher relative growth.
- Compounding Returns: Understanding percentage change is crucial for grasping the power of compound interest, where returns generate further returns. Each period’s percentage gain is applied to a growing base, leading to exponential growth over time.
Analyzing Business Growth, Decline, and Profitability
Businesses rely heavily on percentage change to gauge their health, identify trends, and make strategic decisions.
- Revenue Growth: Companies track the percentage increase or decrease in their sales revenue quarter-over-quarter or year-over-year. A 10% year-over-year revenue growth signals expansion, while a -5% indicates contraction. This helps management understand market share, customer acquisition effectiveness, and product demand.
- Profit Margin Evolution: Profit margins (e.g., net profit margin) are often expressed as percentages. Tracking the percentage change in these margins over time reveals whether a company is becoming more or less efficient at converting revenue into profit. A rising profit margin percentage is generally a positive sign.
- Expense Management: Businesses monitor percentage changes in various expenses (e.g., cost of goods sold, operating expenses). A disproportionate percentage increase in expenses compared to revenue can signal efficiency problems or rising costs.
- Market Share Analysis: Businesses often compare their sales growth percentage to that of their competitors or the overall market to determine if they are gaining or losing market share.
Understanding Market Volatility and Economic Indicators
Broader financial markets and economic data are awash with percentage changes that inform investors, policymakers, and the public.
- Stock Market Indices: News reports constantly highlight percentage changes in indices like the S&P 500, Dow Jones Industrial Average, or NASDAQ. A “market up 1.5%” provides immediate insight into the overall sentiment and direction of the economy.
- Inflation Rates: Inflation is universally reported as a percentage change in the consumer price index (CPI) over a specific period. A “3% inflation rate” means that, on average, prices have increased by 3% from the previous year, impacting purchasing power.
- Interest Rate Fluctuations: Central banks often announce percentage point changes in key interest rates. While sometimes referred to as “basis points” (100 basis points = 1 percentage point), these still represent a relative shift in the cost of borrowing.
- GDP Growth: Gross Domestic Product (GDP) is a key economic indicator, with its growth or contraction reported as a percentage change. A “2.5% GDP growth” signifies economic expansion, influencing investment and policy decisions.
Practical Applications and Real-World Scenarios
Let’s explore some specific examples where percentage change is a critical tool for navigating financial decisions.
Stock Price Movements and Portfolio Rebalancing
Imagine you own a stock that was purchased at $50 per share. Today, it trades at $65. The percentage gain is:
Percentage Change = [ ($65 – $50) / $50 ] * 100 = 30%

Conversely, if another stock you own dropped from $120 to $90:
Percentage Change = [ ($90 – $120) / $120 ] * 100 = -25%
These percentage figures inform your decision to hold, buy more, or sell. A significant percentage loss might trigger a stop-loss order, while a substantial percentage gain might prompt you to take profits or rebalance your portfolio to maintain your desired asset allocation. For instance, if your target is 60% equities and a strong bull market pushes your equity portion to 70% (a 16.67% percentage increase in allocation), you might sell some stocks to rebalance back to 60%.
Budget Variance Reporting
For personal finance and business budgeting, percentage change helps identify deviations from planned expenditures or income.
Let’s say your monthly budgeted expense for groceries was $400. In a particular month, you spent $460.
Percentage Variance = [ ($460 – $400) / $400 ] * 100 = 15%
A 15% overspend in groceries is a clear signal to examine spending habits in that category. Similarly, if your projected side hustle income was $1,000, but you only earned $800:
Percentage Variance = [ ($800 – $1,000) / $1,000 ] * 100 = -20%
This 20% shortfall indicates a need to either adjust your income projections or find ways to boost earnings.
Loan Interest and Credit Card Debt
Understanding percentage change is crucial when dealing with interest rates on loans or credit cards. If your credit card interest rate was 18% and increased to 22%, the absolute change is 4 percentage points. However, the percentage change in the interest rate itself is:
Percentage Change = [ (22 – 18) / 18 ] * 100 = 22.22%
This means the cost of carrying a balance has increased by over 22% relative to its previous rate, highlighting a significant financial impact.
Navigating the Nuances and Potential Pitfalls
While robust, percentage change has specific scenarios where its interpretation requires careful consideration.
The “Zero” Problem
A critical limitation arises when the old value (denominator) is zero. In mathematics, division by zero is undefined. If a company had $0 revenue last year and $100,000 this year, the percentage change formula cannot be used directly. In such cases, it’s more appropriate to state the absolute change or describe it as an “infinite growth” from zero. Similarly, if a value decreases to zero, the percentage decrease is always -100% (e.g., an asset worth $100 that becomes worthless).
Distinguishing Percentage Change from Percentage Points
A common mistake, particularly in media reporting, is confusing “percentage change” with “percentage points.”
- Percentage Change: As discussed, this is the relative change between two numbers expressed as a percentage of the original.
- Percentage Points: This refers to the absolute difference between two percentages.
For example, if an interest rate goes from 5% to 7%, the absolute increase is 2 percentage points. However, the percentage change in the interest rate itself is:
[ (7 – 5) / 5 ] * 100 = 40%
This is a substantial difference in interpretation. Always be precise with your terminology to avoid misleading conclusions.
Base Number Sensitivity
The percentage change is highly sensitive to the initial (old) value. A small absolute change can result in a massive percentage change if the initial value is very small. For instance, an investment growing from $1 to $10 is a 900% increase. The same $9 absolute increase from $100 to $109 is only a 9% increase. Contextualizing the base number is always important for a balanced understanding.
Leveraging Financial Tools for Seamless Calculation
Fortunately, calculating percentage change doesn’t require manual computation in most modern financial scenarios. Various tools simplify this process:
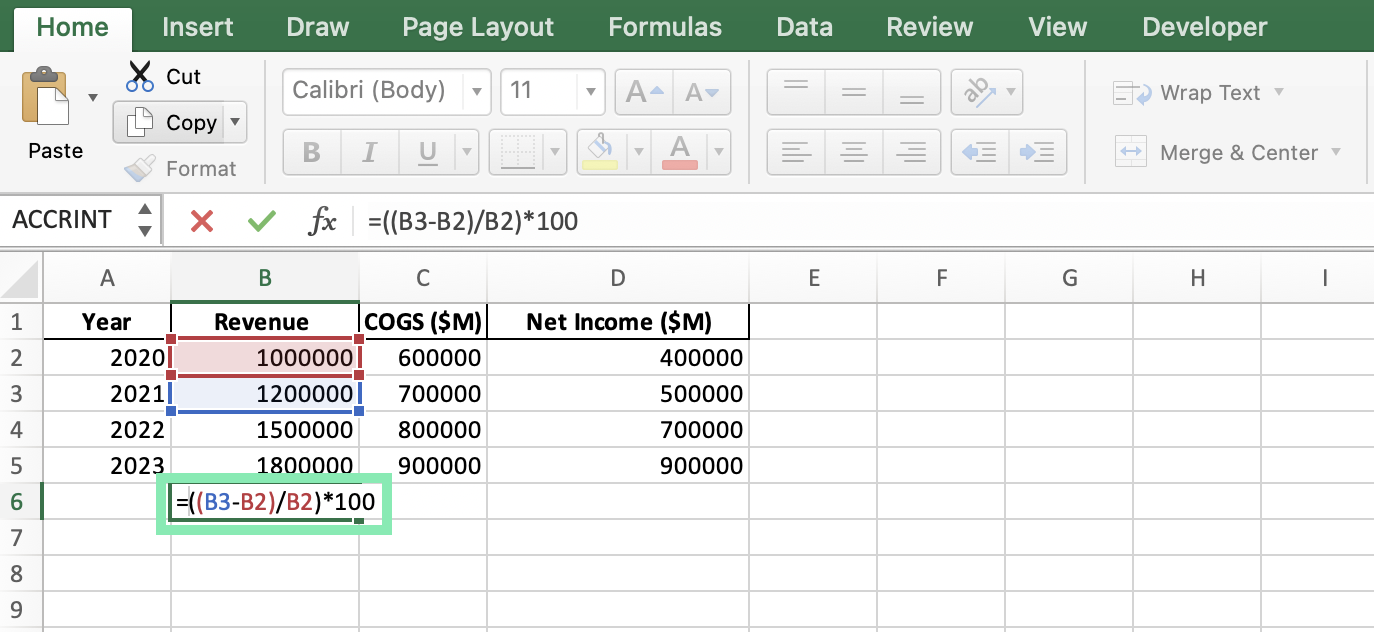
Spreadsheets (Excel, Google Sheets)
Spreadsheets are the go-to tool for financial analysis. The formula is easily implemented:
=(B2-A2)/A2 (where A2 is the Old Value and B2 is the New Value). Then, format the cell as a percentage. This allows for quick calculations across large datasets and for building dynamic financial models.
Online Calculators and Financial Apps
Numerous websites and mobile applications offer dedicated percentage change calculators, often integrated into broader financial analysis tools. These are convenient for quick, one-off calculations without needing to set up a spreadsheet.
Integrated Financial Software
Professional financial software, trading platforms, and accounting systems often display percentage changes automatically for various metrics, from stock price movements to revenue growth, making real-time analysis seamless for businesses and investors.
Conclusion
The percentage of change is more than just a mathematical formula; it’s a fundamental lens through which we interpret financial data, assess performance, and make informed decisions. From tracking your personal investments and managing household budgets to analyzing corporate growth and understanding macroeconomic trends, its application is pervasive and indispensable. By grasping its calculation, understanding its critical role in financial analysis, and being mindful of its nuances, you gain a powerful tool that transforms raw numbers into actionable insights, empowering you to navigate the complex world of money with greater clarity and confidence. Mastering this simple yet profound concept is an essential step towards financial literacy and strategic financial management.
aViewFromTheCave is a participant in the Amazon Services LLC Associates Program, an affiliate advertising program designed to provide a means for sites to earn advertising fees by advertising and linking to Amazon.com. Amazon, the Amazon logo, AmazonSupply, and the AmazonSupply logo are trademarks of Amazon.com, Inc. or its affiliates. As an Amazon Associate we earn affiliate commissions from qualifying purchases.