In the dynamic world of finance, understanding and accurately interpreting numerical relationships is paramount. From analyzing investment returns to managing budgets, and from evaluating business performance to comprehending economic shifts, numbers tell a story. However, raw numbers alone often lack the context needed for meaningful insights. This is where the concept of percentage difference becomes an indispensable tool. It provides a standardized way to compare two quantities, revealing not just if they differ, but by how much in relative terms, making comparisons across various scales both possible and insightful.
This article delves into the core mechanics of calculating percentage difference, distinguishing it from related concepts like percentage change, and illustrating its critical applications across a spectrum of financial scenarios. By mastering this fundamental calculation, you equip yourself with a powerful analytical lens to make more informed decisions, whether you’re a seasoned investor, a meticulous budgeter, or an aspiring financial analyst.

The Foundation: Understanding Absolute vs. Relative Change
Before diving into the specifics of percentage difference, it’s crucial to grasp the distinction between absolute and relative change. This foundational understanding underpins why percentage difference is such a vital metric in financial analysis.
What is Absolute Change?
Absolute change is the simplest form of comparison between two numbers. It is merely the direct numerical difference between them. If you have two values, Value A and Value B, the absolute change is simply |Value A – Value B|. For instance, if a stock’s price increased from $50 to $55, the absolute change is $5. If your monthly expenses went from $2,000 to $2,100, the absolute change is $100.
While absolute change tells you the raw numerical shift, it often lacks the necessary context. A $5 increase might be significant for a $10 stock but negligible for a $1,000 stock. Similarly, a $100 increase in expenses feels very different if your income is $3,000 versus $10,000.
Why Relative (Percentage) Change Matters More
Relative change, expressed as a percentage, provides this crucial context. Instead of just stating the numerical difference, it expresses that difference as a proportion of the values being compared. This allows for a standardized comparison regardless of the magnitude of the original numbers. It helps answer the question: “How significant is this difference in relation to the numbers themselves?”
In finance, relative change is paramount because it allows for:
- Comparability: You can compare the performance of a high-value asset against a low-value asset. A 10% gain on a $1,000 stock is directly comparable in terms of proportional growth to a 10% gain on a $100 stock.
- Contextual Understanding: It provides a clearer sense of impact. A 2% increase in inflation rate from 1% to 3% is far more impactful than a 2% increase from 100% to 102%.
- Trend Analysis: Over time, percentage changes reveal growth rates, decline rates, and volatility more effectively than absolute figures.
Key Scenarios in Finance
Percentage-based metrics are woven into the fabric of financial reporting and analysis. Consider:
- Stock Prices: Investors don’t just look at how many dollars a stock gained but its percentage gain (e.g., “XYZ Corp. rose 5% today”).
- Budget Variances: Businesses and individuals analyze budget variances as percentages to understand the efficiency of spending (e.g., “Marketing spend was 15% over budget”).
- Interest Rates: Changes in interest rates are often discussed in terms of basis points, which are fractional percentages, highlighting the sensitivity of financial markets.
- Profit Margins: Companies compare profit margins as percentages to gauge operational efficiency relative to revenue.
The Formula for Percentage Difference
The percentage difference formula is specifically designed to measure the relative difference between two numbers when neither number is clearly a “starting” or “ending” point. It treats both numbers equally by comparing their difference to their average.
Deconstructing the Formula
The formula for percentage difference is as follows:
Percentage Difference = [ |Value 1 – Value 2| / ( (Value 1 + Value 2) / 2 ) ] * 100
Let’s break down each component:
- |Value 1 – Value 2|: This is the absolute difference between the two numbers. The vertical bars denote absolute value, meaning we always take the positive difference, regardless of which number is larger.
- (Value 1 + Value 2) / 2: This calculates the average (or midpoint) of the two numbers.
- Division: We divide the absolute difference by the average. This normalizes the difference relative to the scale of the numbers themselves.
- * 100: Finally, we multiply by 100 to express the result as a percentage.
Step-by-Step Calculation Guide
Let’s walk through an example relevant to personal finance:
Imagine you are comparing two different investment funds’ expense ratios. Fund A has an expense ratio of 0.75%, and Fund B has an expense ratio of 0.60%. You want to know the percentage difference between these two figures.
-
Identify Value 1 and Value 2:
- Value 1 (V1) = 0.75
- Value 2 (V2) = 0.60
-
Calculate the Absolute Difference:
- |V1 – V2| = |0.75 – 0.60| = 0.15
-
Calculate the Average of the Two Values:
- (V1 + V2) / 2 = (0.75 + 0.60) / 2 = 1.35 / 2 = 0.675
-
Divide the Absolute Difference by the Average:
- 0.15 / 0.675 ≈ 0.2222
-
Multiply by 100 to get the Percentage Difference:
- 0.2222 * 100 = 22.22%
So, the percentage difference between the two expense ratios is approximately 22.22%. This means that the expense ratios differ by about 22.22% relative to their average.
When to Use This Formula
The percentage difference formula is best used when you are comparing two distinct values where neither is inherently the “base” or “starting point.”
- Comparing the prices of two similar products from different vendors.
- Assessing the difference in yield between two bonds issued by different entities.
- Analyzing the variance in salary offers from two different companies for the same role.
- Comparing the market share of two competing companies in a given quarter.
It offers a symmetrical comparison, meaning the result is the same whether you start with V1 or V2 as the first number.
Distinguishing Percentage Difference from Percentage Change
While often used interchangeably in casual conversation, “percentage difference” and “percentage change” are distinct financial metrics, each with its specific application and interpretation. Understanding this nuance is critical for accurate financial analysis.
Percentage Change (New – Old / Old * 100)
Percentage change measures the relative increase or decrease of a value from an initial or base value to a final or new value. It is inherently directional and dependent on the chosen base.
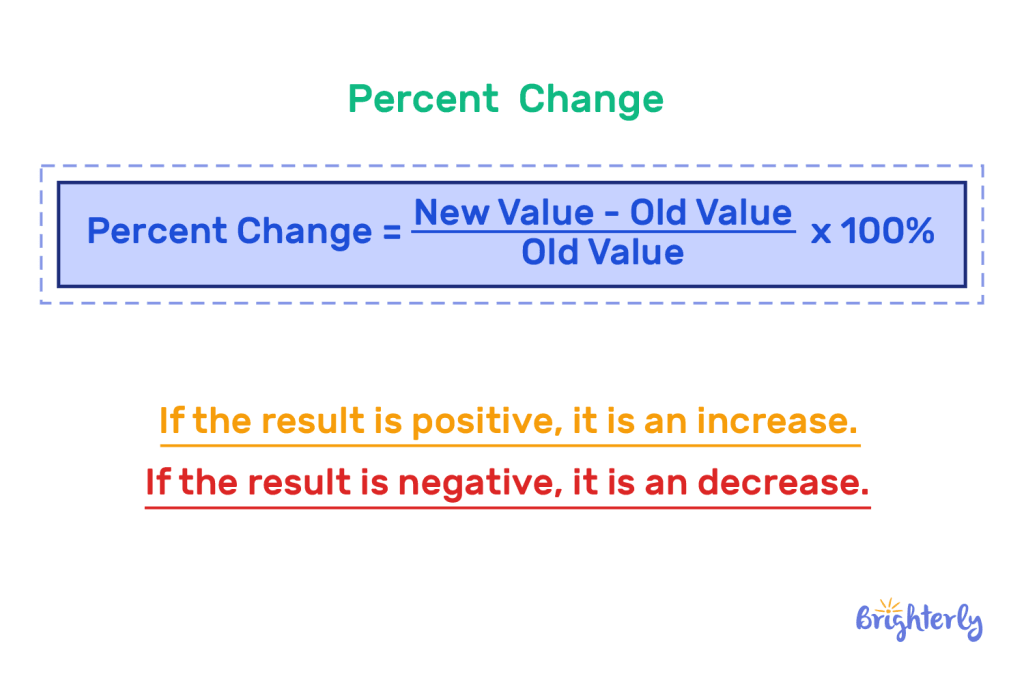
The formula for percentage change is:
Percentage Change = [ (New Value – Old Value) / Old Value ] * 100
- Positive Result: Indicates a percentage increase.
- Negative Result: Indicates a percentage decrease.
Example: If your investment portfolio grew from $10,000 (Old Value) to $12,000 (New Value):
Percentage Change = [ ($12,000 – $10,000) / $10,000 ] * 100 = ( $2,000 / $10,000 ) * 100 = 0.20 * 100 = 20% increase.
However, if it declined from $12,000 (Old Value) to $10,000 (New Value):
Percentage Change = [ ($10,000 – $12,000) / $12,000 ] * 100 = ( -$2,000 / $12,000 ) * 100 ≈ -0.1667 * 100 = -16.67% decrease.
Notice that a 20% increase from $10,000 to $12,000 is not reciprocated by a 20% decrease from $12,000 to $10,000. This asymmetry is a key characteristic of percentage change and highlights its base-dependent nature.
Why the Distinction is Crucial in Financial Reporting
The distinction is crucial for clear and unambiguous financial communication and analysis:
- Directionality: Percentage change explicitly shows growth or decline relative to a starting point, which is essential for tracking performance over time (e.g., year-over-year growth, quarterly earnings changes).
- Base Sensitivity: The choice of the “old value” or “base” significantly impacts the percentage change. This is appropriate when a clear baseline exists.
- Avoid Misinterpretation: Using percentage difference when percentage change is warranted, or vice-versa, can lead to misleading conclusions. For instance, stating the “difference” between current market share and previous market share using the average of both might obscure the actual growth trajectory from the starting point.
Practical Financial Examples of Each
-
Percentage Change:
- Return on Investment (ROI): Calculating the percentage increase in an investment’s value from purchase to sale.
- Inflation Rate: Measuring the percentage increase in the general price level of goods and services over time.
- Revenue Growth: Tracking the percentage increase in a company’s sales from one fiscal period to the next.
- Budget Variance: The percentage by which actual spending deviates from planned spending.
-
Percentage Difference:
- Comparing Interest Rates: What is the percentage difference between a 3.5% mortgage rate and a 4.0% mortgage rate? (Often used when there isn’t a natural “old” or “new” rate, but rather two rates being compared simultaneously).
- Analyzing P/E Ratios: What is the percentage difference between Company X’s Price-to-Earnings ratio of 15 and Company Y’s P/E ratio of 18?
- Product Pricing: Comparing the price disparity between two competing products where neither is a baseline.
In essence, use percentage change when measuring evolution from a defined starting point, and percentage difference when making a symmetrical comparison between two distinct, concurrently existing values.
Applying Percentage Difference in Real-World Financial Scenarios
Mastering the calculation of percentage difference is not merely an academic exercise; it’s a practical skill with broad applications across various facets of personal and business finance. Here’s how it empowers more insightful financial analysis:
Investment Portfolio Analysis
Percentage difference is invaluable for making comparative assessments within an investment portfolio or across different investment opportunities:
- Comparing Asset Performance: If you hold two different stocks, Fund A that grew by $500 and Fund B that grew by $700, the absolute figures alone don’t tell you which performed relatively better unless you know their initial values. However, if you want to understand the disparity between their absolute gains relative to their combined performance, percentage difference could be applied. More commonly, you might compare the percentage difference between the volatility of two assets (e.g., comparing their beta coefficients) to assess their relative risk profiles.
- Evaluating Fund Fees: As seen in our earlier example, comparing the percentage difference between expense ratios of two mutual funds or ETFs helps investors understand the relative cost burden. A small absolute difference in fees can translate to a significant percentage difference, impacting long-term returns.
- Assessing Price Discrepancies: Investors might use it to compare the current market price of a stock against its intrinsic value derived from a valuation model, helping to gauge whether the stock is over or undervalued relative to a theoretical fair price.
Budgeting and Expense Management
For individuals and businesses alike, managing money effectively hinges on understanding spending patterns and variances. Percentage difference offers a robust framework for this:
- Comparing Spending Categories: You can compare the percentage difference in spending between “Groceries” and “Dining Out” to understand the relative allocation of your food budget. For instance, if you spent $600 on groceries and $400 on dining, the percentage difference helps quantify how much more (or less) one category consumes relative to the other on average.
- Actual vs. Budgeted Variances (Comparative): While percentage change is often used for actual vs. budgeted (e.g., “we were 10% over budget”), percentage difference could be used if you wanted to compare the magnitude of variance between two different budget lines. For example, how much does the variance in marketing spend differ from the variance in operational spend in percentage terms, relative to their combined variance? This provides a symmetrical view of the disparity in their budget performance.
- Prioritizing Savings Goals: If you have two savings goals (e.g., down payment for a house and retirement), you could use percentage difference to compare how close you are to each goal, providing a balanced view of your progress if you want to see the disparity in progress relative to their combined current status.
Business Finance and Profitability
In the corporate world, percentage difference informs strategic decisions, performance evaluation, and competitive analysis:
- Product Line Profitability: A business might compare the percentage difference in gross profit margins between two different product lines (e.g., Product A: 40% margin, Product B: 30% margin) to understand the relative profitability disparity and guide resource allocation.
- Operational Efficiency: Comparing the percentage difference in energy consumption between two manufacturing plants or the percentage difference in labor costs per unit between two production teams can highlight operational inefficiencies or best practices.
- Competitive Benchmarking: Companies frequently use percentage difference to compare their key financial ratios (e.g., Debt-to-Equity ratio, Current Ratio) against those of competitors, revealing how their financial health stacks up against the industry average or direct rivals.
- Revenue Stream Analysis: If a company has two main revenue streams, say subscription services and product sales, calculating the percentage difference between their contributions to total revenue offers insight into their relative importance and growth potential.
Economic Analysis
Economists and analysts use percentage difference to compare various economic indicators and understand relative disparities:
- Inflation Rates Across Regions: Comparing the percentage difference in inflation rates between two different countries or economic zones provides a relative measure of price stability disparities.
- Interest Rate Differentials: While simply subtracting interest rates gives an absolute spread, one might use percentage difference to compare the relative gap between, say, the federal funds rate and a prime lending rate, offering insight into monetary policy transmission.
- GDP Growth Disparities: Comparing the percentage difference between the GDP growth rates of two nations can offer a symmetrical perspective on their relative economic dynamism.
Tools and Tips for Efficient Calculation
While the formula for percentage difference is straightforward, leveraging the right tools and being aware of common pitfalls can significantly enhance efficiency and accuracy in your financial calculations.
Leveraging Spreadsheets (Excel, Google Sheets functions)
Spreadsheet software like Microsoft Excel or Google Sheets are indispensable tools for financial analysis, making percentage difference calculations quick and error-free.
- Direct Formula Application: You can directly input the formula into a cell.
- If Value 1 is in cell A1 and Value 2 is in cell B1, the formula would be:
=ABS(A1-B1)/((A1+B1)/2)*100 ABS()function ensures you get the absolute difference.
- If Value 1 is in cell A1 and Value 2 is in cell B1, the formula would be:
- Named Ranges: For clarity, especially in complex spreadsheets, define named ranges for your values (e.g.,
ExpenseRatioFundA,ExpenseRatioFundB). This makes your formulas more readable:=ABS(ExpenseRatioFundA-ExpenseRatioFundB)/((ExpenseRatioFundA+ExpenseRatioFundB)/2)*100. - Templates: Create reusable templates for common financial comparisons to save time.
Online Calculators and Financial Software
For quick, ad-hoc calculations, numerous online percentage difference calculators are available. Simply input your two numbers, and the calculator provides the result instantly. Many financial software platforms (e.g., accounting software, investment analysis tools) also incorporate these calculations as part of their reporting features, often presenting them visually in dashboards. These tools are excellent for verification or for users who do not regularly work with spreadsheets.
Common Pitfalls to Avoid
Even with simple formulas, errors can occur. Be mindful of these common traps:
- Mixing Up Percentage Difference with Percentage Change: This is the most significant pitfall. As discussed, these are distinct metrics. Ensure you select the correct formula based on whether you need a symmetrical comparison or a directional change from a base.
- Division by Zero: If the average of your two numbers is zero (which implies both numbers are zero), the formula will result in a division by zero error. In financial contexts, two numbers being zero means there’s no quantity to compare, rendering the calculation meaningless. Ensure your input values are appropriate.
- Misinterpreting Results: A high percentage difference doesn’t always mean a critical issue. It’s a relative measure. Always consider the absolute values and the financial context. A 50% difference between $1 and $2 is numerically correct but might not be as impactful as a 50% difference between $1 million and $2 million.
- Incorrect Input Values: Double-check that you are using the correct numbers for Value 1 and Value 2. Typographical errors can lead to drastically incorrect results.
- Units: Ensure that both numbers you are comparing are in the same units (e.g., both in dollars, both in percentages, both in units of quantity). Comparing a dollar value to a percentage directly will yield a nonsensical result.
By being meticulous with your inputs and understanding the distinct applications of percentage difference, you can leverage this powerful financial tool to its fullest potential, enhancing the clarity and insight of your financial analysis.

Conclusion
The ability to accurately find the percentage difference between two numbers is a cornerstone of effective financial analysis. It transcends the limitations of absolute figures by providing crucial context, enabling meaningful comparisons across varying scales and magnitudes. We’ve explored its core formula, meticulously differentiated it from percentage change, and illuminated its wide-ranging applications—from discerning investment performance and optimizing personal budgets to enhancing business profitability and informing economic assessments.
In a world increasingly driven by data, the power to interpret numbers goes beyond mere calculation; it’s about deriving actionable insights. By mastering the calculation of percentage difference and understanding when and how to apply it, you equip yourself with an invaluable skill that fosters clearer communication, sharper decision-making, and a more profound understanding of the financial landscape. Embrace this fundamental tool, and unlock a richer perspective on the numerical stories that shape our financial lives.
aViewFromTheCave is a participant in the Amazon Services LLC Associates Program, an affiliate advertising program designed to provide a means for sites to earn advertising fees by advertising and linking to Amazon.com. Amazon, the Amazon logo, AmazonSupply, and the AmazonSupply logo are trademarks of Amazon.com, Inc. or its affiliates. As an Amazon Associate we earn affiliate commissions from qualifying purchases.