
In the dynamic world of personal finance, investing, and business operations, understanding change is paramount. While growth often captures the spotlight, the ability to accurately measure decline – or percent decrease – is equally, if not more, critical for making informed decisions, mitigating risks, and strategizing for future resilience. Whether you’re tracking the depreciation of an asset, analyzing a drop in investment value, evaluating budget cuts, or monitoring a decline in sales, the concept of percent decrease provides a standardized, universally understood metric to quantify these shifts. It moves beyond a simple numerical reduction, offering a proportional insight that allows for meaningful comparisons across different scales and contexts. This article will demystify the process of calculating percent decrease, exploring its fundamental formula, practical applications within the financial landscape, and the invaluable insights it offers for smarter money management and strategic business decisions.
Understanding the Essence of Percent Decrease
At its core, percent decrease quantifies the relative reduction between an initial value and a final, smaller value. It’s not just about how much something went down, but how much it went down in proportion to what it started with. This distinction is crucial because a $100 decrease might be insignificant for a million-dollar portfolio but catastrophic for a thousand-dollar budget. The percentage figure provides a normalized view, enabling clear communication and comparison of declines, regardless of the absolute scale of the numbers involved.
Why Percent Decrease Matters in Finance
For individuals and businesses alike, percent decrease is a powerful diagnostic tool. In personal finance, it helps us understand the impact of inflation on purchasing power, the depreciation of a car, or the reduction in a savings account balance. For investors, it’s essential for analyzing portfolio drawdowns, understanding the depth of market corrections, or calculating the loss on a particular stock. In business finance, managers use it to track declining revenue, increasing cost of goods sold, shrinking profit margins, or reductions in operational expenses. Accurate calculation allows for timely interventions, realistic forecasting, and strategic adjustments. Without this metric, understanding the true magnitude and implications of financial downturns would be a subjective and often misleading exercise.
The Fundamental Formula Explained
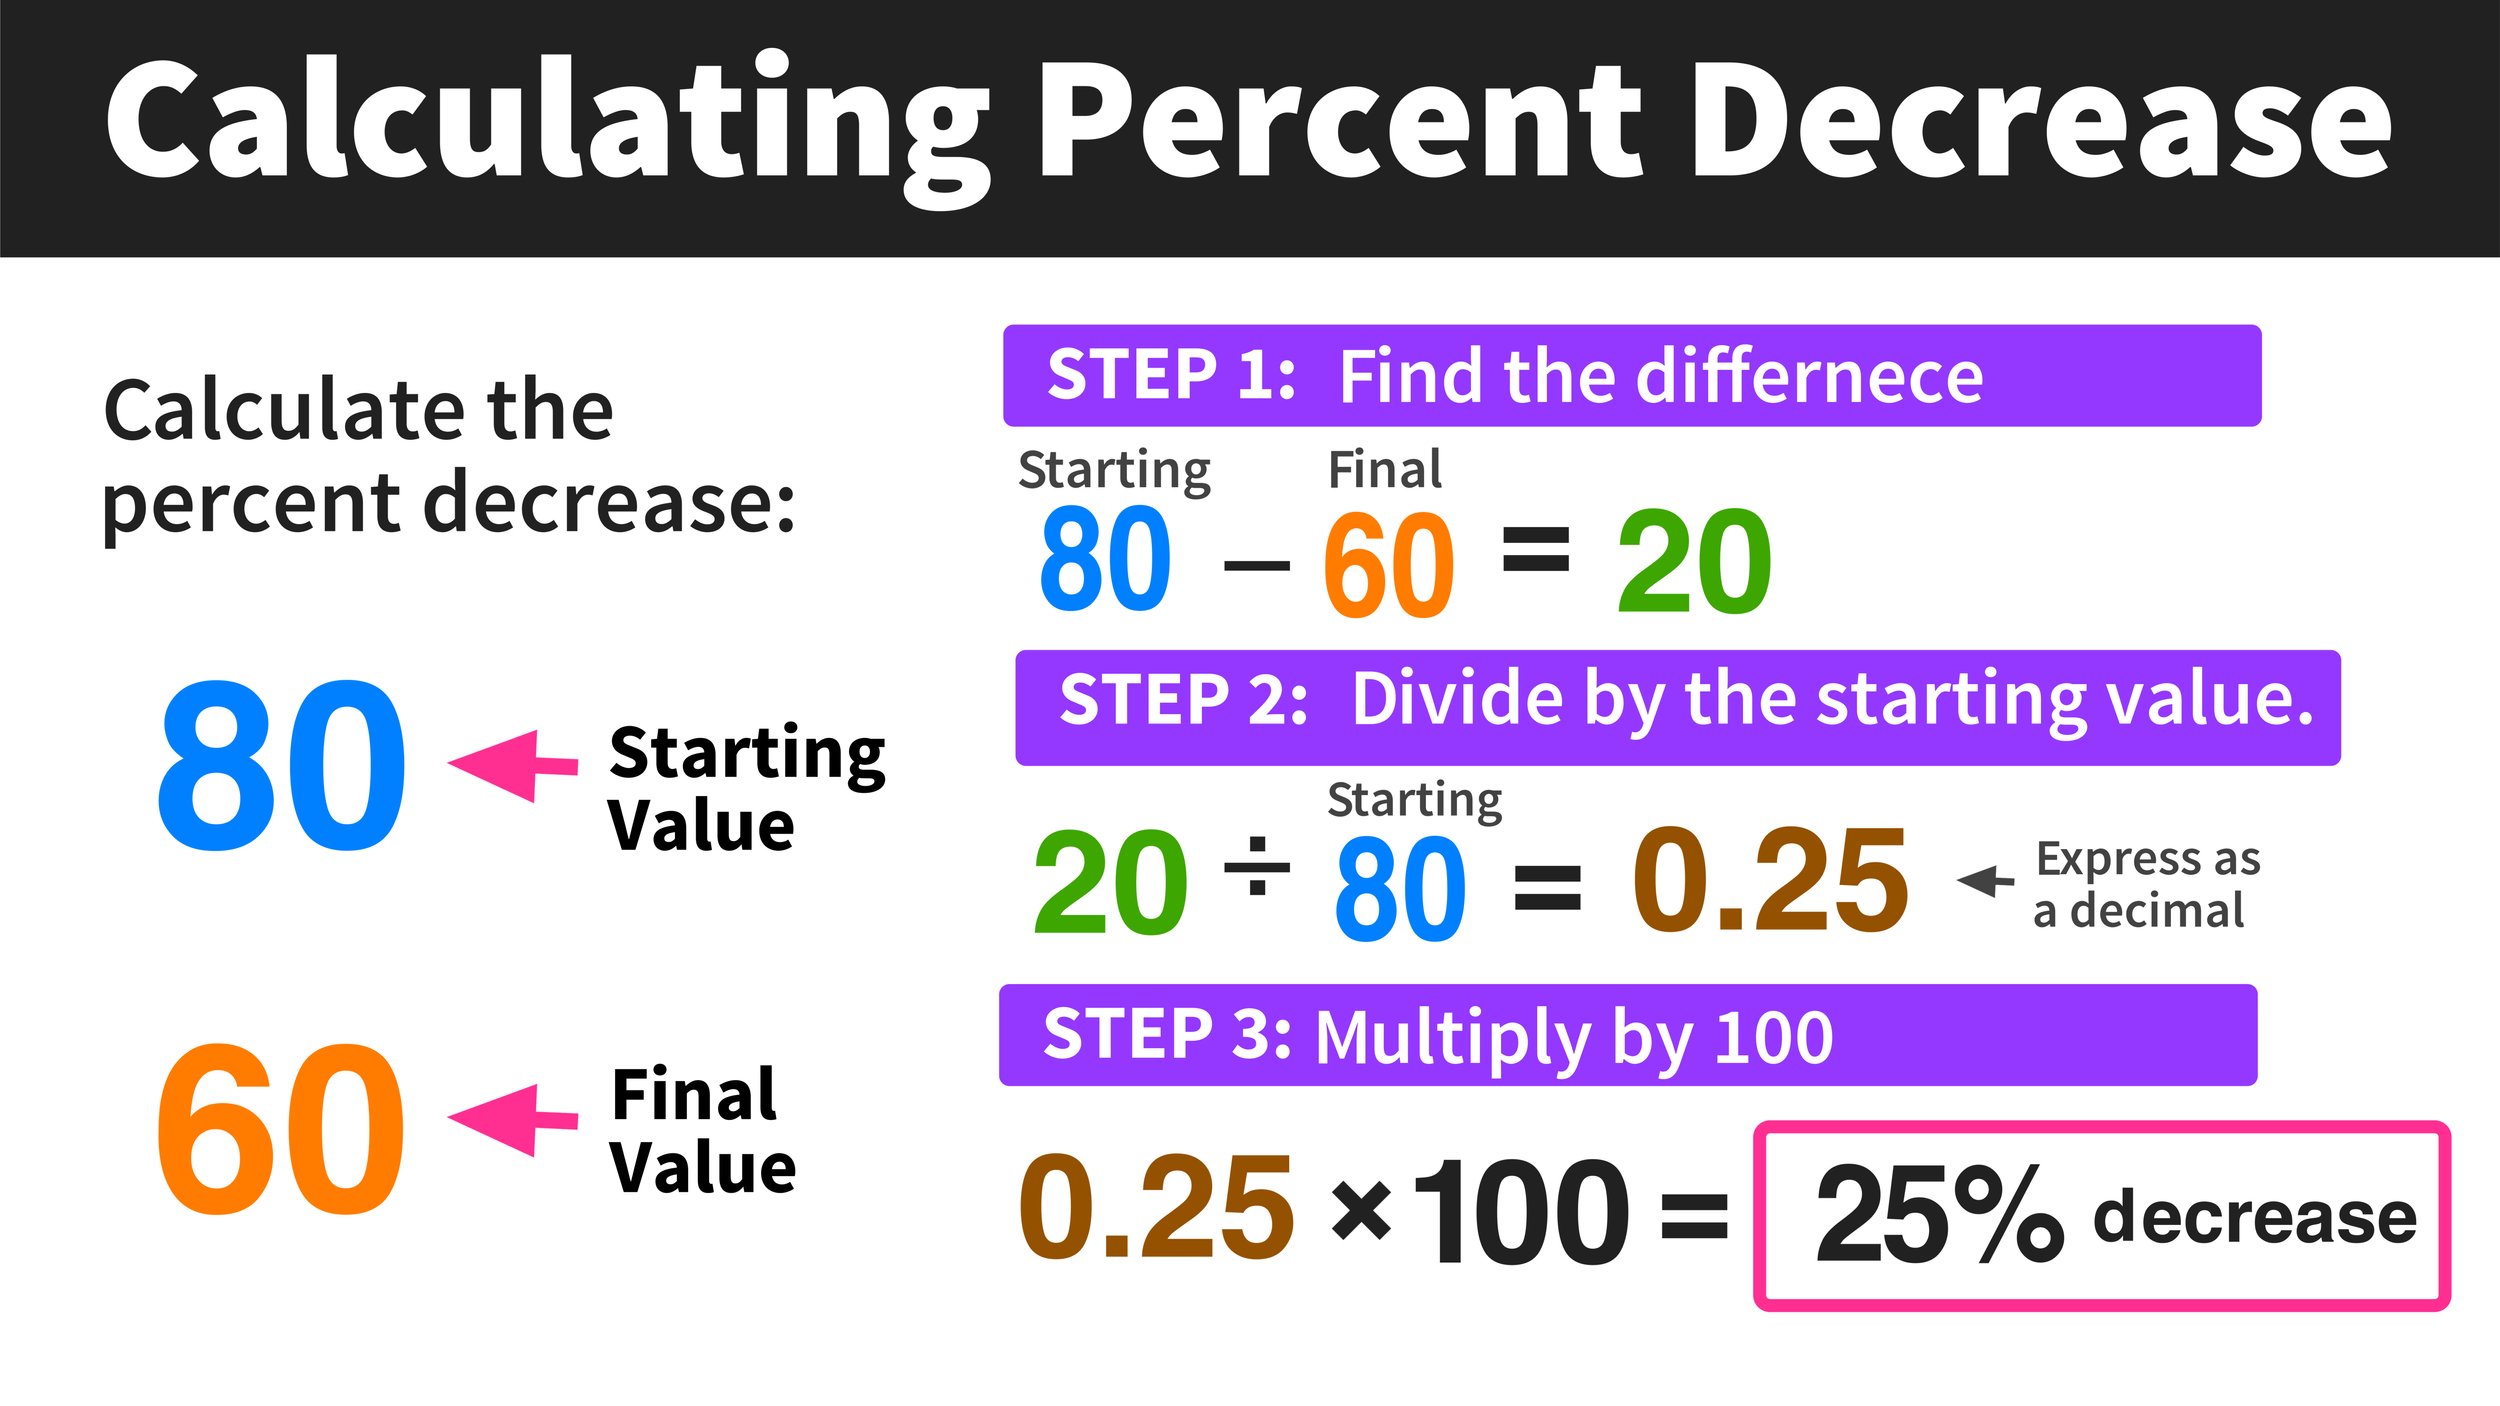
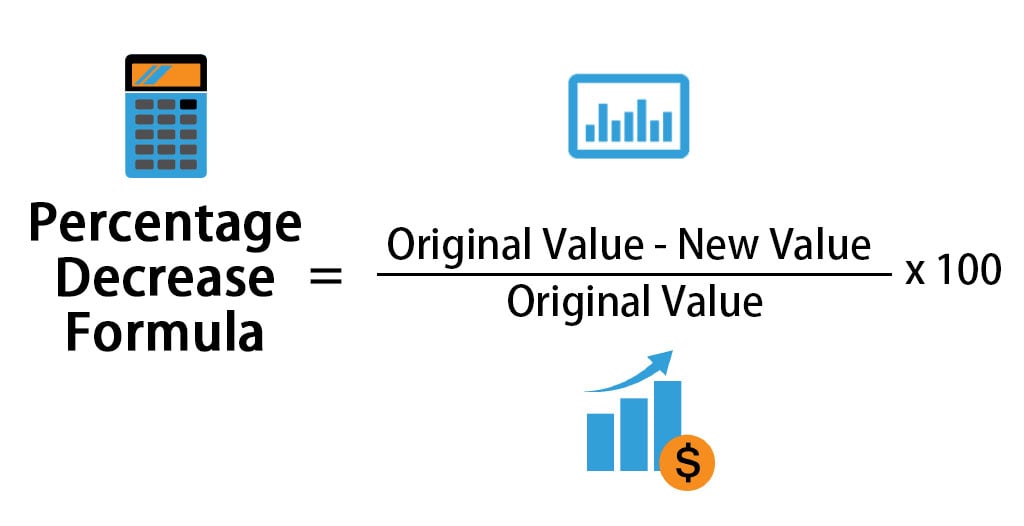
The calculation of percent decrease relies on a straightforward, three-step formula that compares the absolute reduction to the original value. The formula is as follows:
Percent Decrease = [ (Original Value – New Value) / Original Value ] * 100
Let’s break down each component:
- Original Value: This is the starting point, the initial quantity, or the baseline from which the decrease is measured. It’s crucial to correctly identify this value as the denominator in the fraction.
- New Value: This is the final quantity after the decrease has occurred. It will always be less than the original value when calculating a decrease.
- Difference (Original Value – New Value): This first step calculates the absolute amount of the decrease. This tells you how much the value went down in raw numbers.
- Division by Original Value: By dividing the absolute decrease by the original value, you convert the absolute change into a proportional change, expressed as a decimal. This decimal represents the fraction of the original value that was lost.
- Multiplication by 100: Finally, multiplying the decimal by 100 converts this fractional change into a percentage, making it easily interpretable and comparable.
This formula consistently provides a positive percentage value, indicating a decrease. If the result were negative, it would imply an increase, meaning the “New Value” was actually greater than the “Original Value,” and you would be calculating a percent increase instead.
Step-by-Step Calculation for Financial Scenarios
Mastering the percent decrease calculation involves a systematic approach. Let’s walk through the process with practical financial examples, highlighting each critical step.
Identifying Initial and Final Values
The first and most crucial step is accurately identifying the “Original Value” and the “New Value.” Misidentifying these can lead to incorrect calculations and flawed conclusions.
Example 1: Personal Savings Account
- You started the year with $10,000 in your savings account. (Original Value = $10,000)
- Due to an unexpected expense, your account balance is now $8,500. (New Value = $8,500)
Example 2: Stock Investment
- You bought shares of Company X for $50 per share. (Original Value = $50)
- The stock price has dropped to $42 per share. (New Value = $42)
Example 3: Business Revenue
- A company’s quarterly revenue last year was $500,000. (Original Value = $500,000)
- This quarter’s revenue is $450,000. (New Value = $450,000)
Calculating the Absolute Decrease
Once the original and new values are identified, the next step is to find the absolute difference between them. This is simply the Original Value minus the New Value.
Example 1 (Savings):
- Absolute Decrease = $10,000 (Original) – $8,500 (New) = $1,500
Example 2 (Stock):
- Absolute Decrease = $50 (Original) – $42 (New) = $8
Example 3 (Revenue):
- Absolute Decrease = $500,000 (Original) – $450,000 (New) = $50,000
This absolute number tells you the raw monetary value of the decrease, but it doesn’t contextualize it relative to the starting point.
Converting to a Percentage: The Final Step
With the absolute decrease calculated, the final steps involve dividing this decrease by the original value and then multiplying by 100 to express it as a percentage.
Example 1 (Savings):
- Percent Decrease = ($1,500 / $10,000) * 100
- Percent Decrease = 0.15 * 100
- Percent Decrease = 15% (Your savings decreased by 15%)
Example 2 (Stock):
- Percent Decrease = ($8 / $50) * 100
- Percent Decrease = 0.16 * 100
- Percent Decrease = 16% (The stock price decreased by 16%)
Example 3 (Revenue):
- Percent Decrease = ($50,000 / $500,000) * 100
- Percent Decrease = 0.10 * 100
- Percent Decrease = 10% (The company’s revenue decreased by 10%)
These examples demonstrate how a simple calculation provides a powerful, standardized metric for understanding financial shifts.
Real-World Applications in Personal Finance and Investing
The ability to calculate percent decrease is not merely an academic exercise; it’s a vital skill for anyone managing their money or investments. Its applications are broad, offering clarity in various financial situations.
Budgeting and Expense Reduction
For personal finance, percent decrease is instrumental in budgeting. If you aim to reduce your monthly spending on dining out from $400 to $300, you can calculate the percent decrease required: ($400 – $300) / $400 * 100 = 25%. This 25% target gives you a clear goal. Conversely, if your utility bill drops from $150 to $120, a 20% decrease signifies effective energy conservation or a favorable seasonal change. Understanding these percentages helps you identify areas where you are successfully cutting costs and where more effort might be needed.
Analyzing Investment Losses and Market Downturns
In the world of investing, percent decrease is a constant companion. When a stock you own drops from $100 to $75, that’s a 25% decrease, commonly referred to as a “drawdown.” When a market index like the S&P 500 falls by 20% from its peak, it officially signals a “bear market.” Calculating these percentages allows investors to:
- Quantify Risk: Understand the potential downside of an investment.
- Evaluate Performance: Compare the severity of losses across different assets or time periods.
- Inform Decision-Making: Decide when to cut losses, rebalance portfolios, or identify potential buying opportunities during a dip.
Understanding these percentages is crucial for developing a robust investment strategy and managing emotional responses during volatile periods.
Understanding Loan and Debt Reduction
While typically debt reduction is viewed as an “increase” in financial health, the amount of debt itself is decreasing. If you start with a credit card balance of $5,000 and manage to pay it down to $3,500, you’ve achieved a ($5,000 – $3,500) / $5,000 * 100 = 30% decrease in your debt. This calculation provides tangible evidence of progress, motivating continued efforts towards financial freedom. It’s also relevant when a lender decreases your interest rate or loan principal, showing the percentage relief you’ve received.
Evaluating Discount Rates and Sales
Retail and service industries frequently use percent decrease in the form of discounts and sales. A product originally priced at $200 now selling for $150 is offered at a ($200 – $150) / $200 * 100 = 25% discount. For consumers, this helps compare deals and understand true savings. For businesses, it’s vital for calculating markdown strategies, inventory clearance, and assessing the profitability of promotional activities.
Business Finance and Operational Insights
Beyond personal finances, percent decrease is a cornerstone of business analysis, providing critical insights into operational efficiency, market performance, and financial health. Businesses constantly monitor various metrics for declines, using this information to make strategic adjustments.
Measuring Revenue and Profit Declines
One of the most immediate applications for businesses is tracking revenue and profit. A quarter-over-quarter revenue decrease of 10% (as in our earlier example) signals a need for strategic review – perhaps a marketing campaign is underperforming, a product is losing market share, or there’s an economic downturn. Similarly, if gross profit margins fall from 40% to 35%, that’s a (40-35)/40 * 100 = 12.5% decrease in the margin itself, indicating potential issues with pricing, cost of goods sold, or production efficiency. These insights drive decisions on pricing, product development, and sales strategies.
Tracking Cost Efficiencies and Reductions
Conversely, businesses actively seek to decrease costs. If a company reduces its monthly electricity bill from $2,000 to $1,800 through energy-saving initiatives, that’s a ($2,000 – $1,800) / $2,000 * 100 = 10% decrease in utility expenses. Similarly, negotiating a better deal with a supplier might result in a 5% decrease in raw material costs. Tracking these percentage reductions across various operational expenses helps businesses identify successful cost-saving measures, optimize resource allocation, and improve overall profitability.
Supply Chain Optimization and Inventory Management
Effective supply chain management relies heavily on minimizing inefficiencies. A decrease in lead time from 10 days to 8 days represents a 20% reduction, leading to faster delivery and improved customer satisfaction. Similarly, reducing excess inventory from $100,000 to $70,000 means a 30% decrease, freeing up capital and reducing storage costs. By precisely measuring these decreases, businesses can streamline operations, reduce waste, and enhance their competitive edge.
Common Pitfalls and Best Practices
While calculating percent decrease is straightforward, common mistakes can lead to misinterpretations. Adhering to best practices ensures accuracy and meaningful analysis.
Avoiding Misinterpretations of Negative Percentages
When you correctly apply the formula (Original Value – New Value) / Original Value * 100, the result for a decrease will always be a positive percentage. A common error is to subtract the original value from the new value, which would yield a negative percentage. While mathematically correct as a “change,” it is best practice to express a decrease as a positive percentage (e.g., “a 15% decrease,” not “a -15% change”) to avoid confusion. If your calculation results in a negative number, it signals that the new value is actually higher than the original value, meaning you have a percent increase, not a decrease.
The Importance of Context and Timeframes
A percentage decrease is always relative to its context. A 5% decrease in a stock price overnight might be minor, but a 5% decrease in annual revenue for a large corporation could be alarming. Always specify the timeframe over which the decrease occurred (e.g., “month-over-month,” “year-over-year,” “quarterly,” “since peak”). Without a clear timeframe and a defined original value, the percentage figure loses much of its significance. For instance, comparing a stock’s current price to its all-time high will yield a different percentage decrease than comparing it to its price a month ago.
Leveraging Financial Tools for Accuracy
While manual calculation is essential for understanding the concept, for complex financial analysis or large datasets, leverage financial tools. Spreadsheets like Microsoft Excel or Google Sheets have built-in formulas (e.g., =(B2-A2)/A2 where A2 is original and B2 is new) that can automate these calculations, reducing the risk of human error, especially when dealing with numerous data points. Financial software and dashboards also frequently display percent changes, ensuring consistent and accurate reporting. Familiarity with these tools enhances efficiency and reliability in financial tracking and reporting.
In conclusion, the ability to calculate percent decrease is an indispensable skill in today’s financial landscape. From personal budgeting to sophisticated investment analysis and strategic business management, it provides a clear, standardized metric for understanding the magnitude of reductions. By mastering its simple formula and applying it thoughtfully across various scenarios, individuals and organizations can gain deeper insights into their financial health, make more informed decisions, and proactively respond to changing economic conditions. It’s not just about crunching numbers; it’s about empowering yourself with the knowledge to navigate the financial world with greater confidence and precision.
aViewFromTheCave is a participant in the Amazon Services LLC Associates Program, an affiliate advertising program designed to provide a means for sites to earn advertising fees by advertising and linking to Amazon.com. Amazon, the Amazon logo, AmazonSupply, and the AmazonSupply logo are trademarks of Amazon.com, Inc. or its affiliates. As an Amazon Associate we earn affiliate commissions from qualifying purchases.