
In the world of money, understanding growth and change is paramount. Whether you’re tracking your investment portfolio, analyzing business sales figures, or simply monitoring the inflation of everyday goods, the ability to accurately calculate a percentage increase between two numbers is an indispensable skill. It’s more than just a mathematical operation; it’s a fundamental tool for making informed financial decisions, setting realistic goals, and clearly communicating financial performance. This guide will demystify the process, revealing why this calculation is so vital to personal and business finance, and how you can master it with ease.

At its core, a percentage increase quantifies the relative change between an initial value and a final, larger value. It answers the question: “By what proportion has this number grown, expressed as a fraction of 100?” For anyone navigating the complexities of finance, from personal budgeting to intricate investment strategies, grasping this concept translates directly into greater financial literacy and empowerment.
The Core Formula for Percentage Increase
The calculation for a percentage increase is straightforward, yet incredibly powerful. It relies on three key components: an original value, a new value, and the difference between them. Understanding this formula is the first step towards unlocking a deeper understanding of financial dynamics.
Understanding the Components
Before diving into the steps, let’s define the terms we’ll be using:
- Original Value (or Base Value): This is the starting point, the initial number from which the increase is measured. In financial terms, this could be your initial investment, last year’s revenue, or a product’s original price.
- New Value (or Final Value): This is the endpoint, the number after the increase has occurred. Examples include your current investment value, this year’s revenue, or the increased price of a product.
- Difference: This is the absolute amount by which the new value exceeds the original value. It represents the raw magnitude of the growth.
The importance of correctly identifying the original value cannot be overstated. It serves as the baseline against which all growth is measured. Using the wrong base will lead to an inaccurate percentage and potentially flawed financial conclusions.
Step-by-Step Calculation
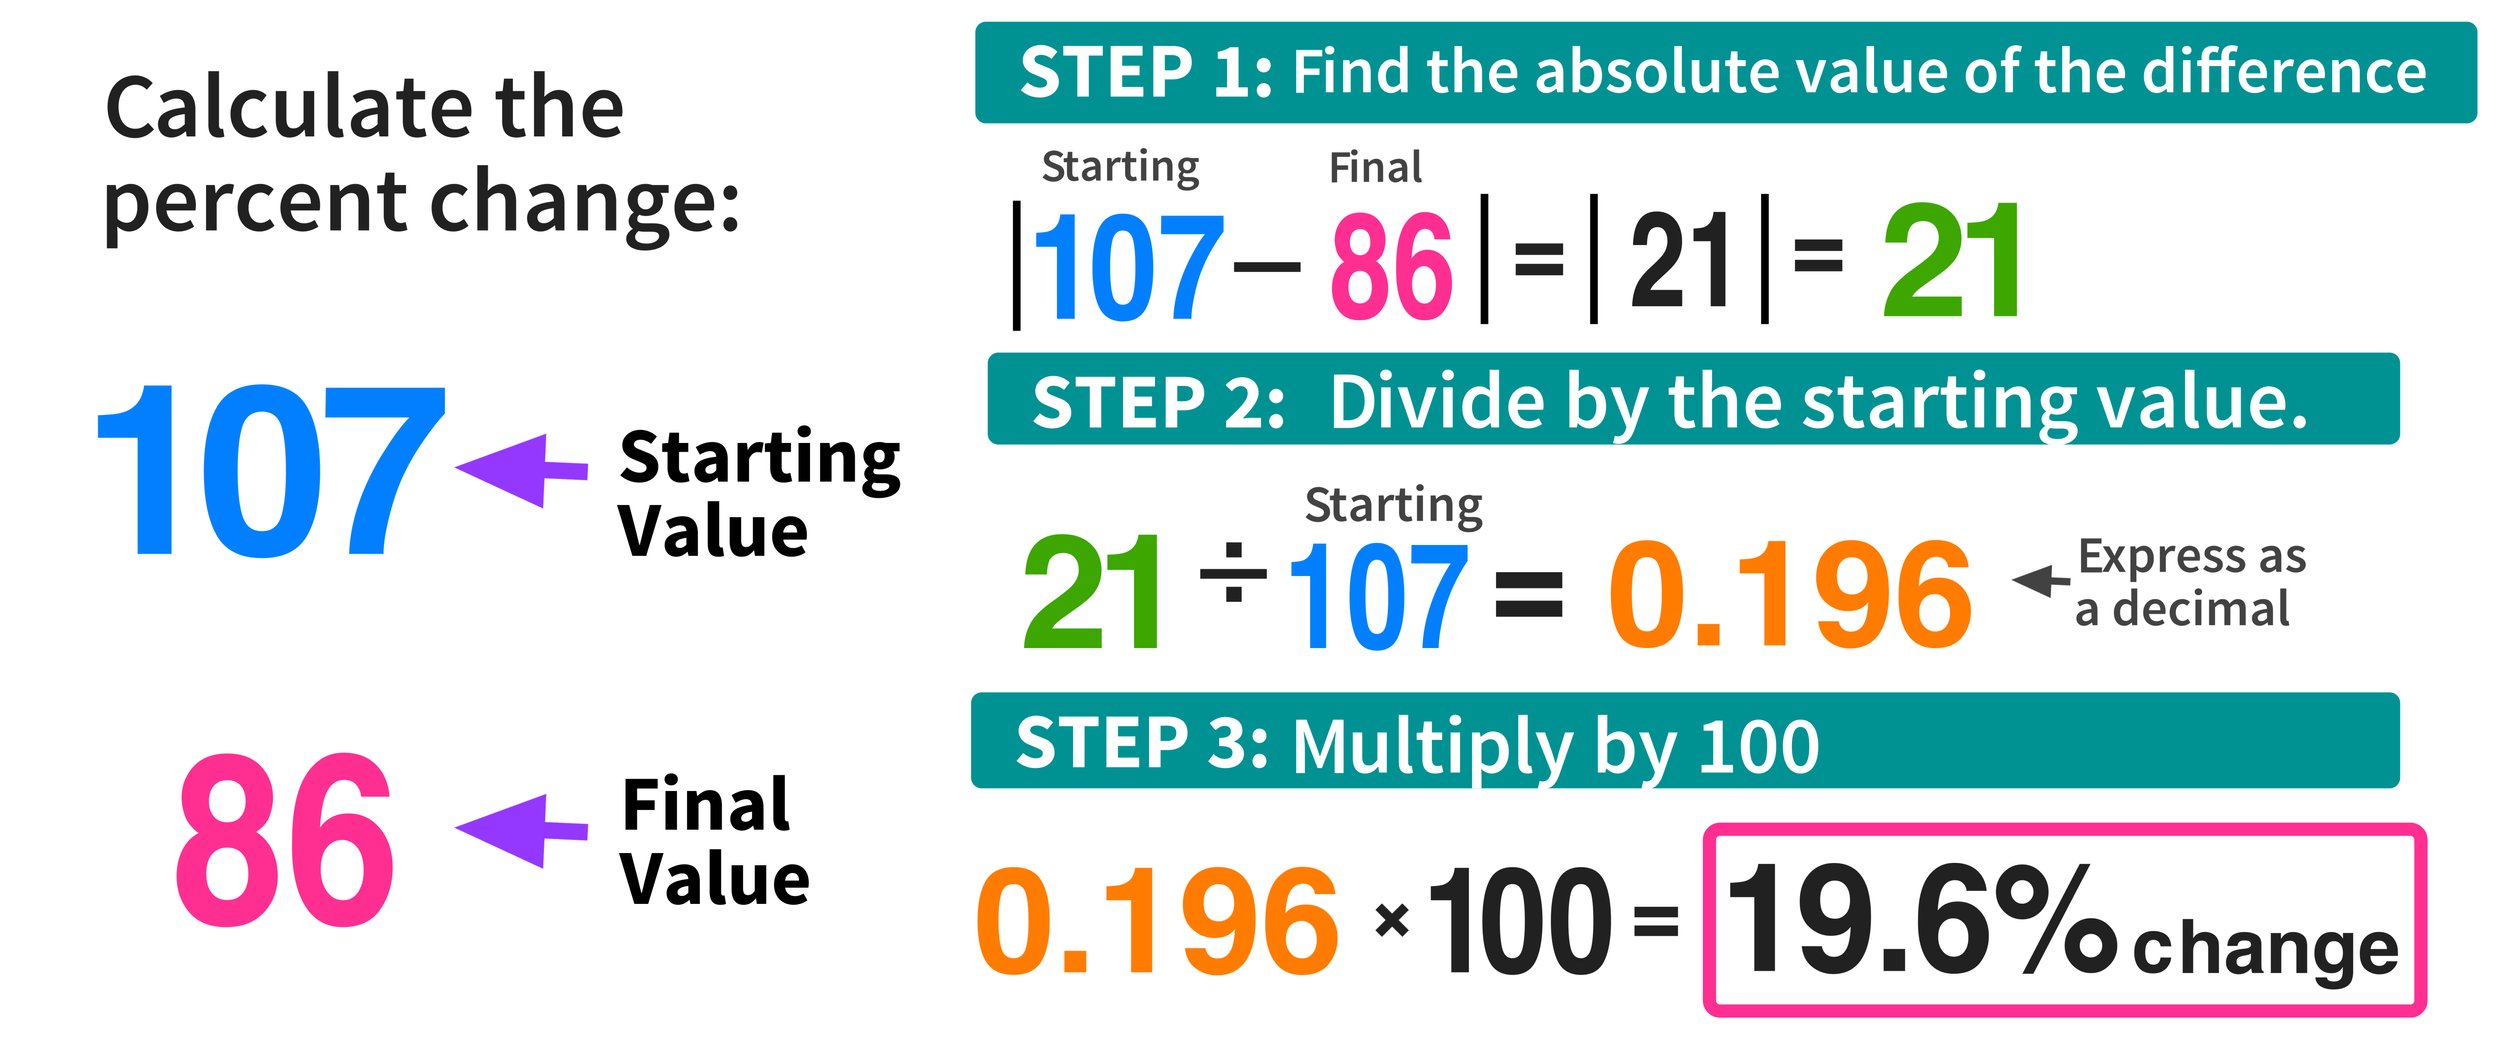
The process to calculate a percentage increase is a simple three-step method:
-
Find the Difference: Subtract the Original Value from the New Value.
- Difference = New Value – Original Value
-
Divide by the Original Value: Take the difference you calculated and divide it by the Original Value. This will give you a decimal representing the proportional increase.
- Decimal Increase = Difference / Original Value
-
Multiply by 100: To convert the decimal into a percentage, multiply the result by 100.
- *Percentage Increase = (Decimal Increase) * 100%*
Combining these steps, the complete formula looks like this:
Percentage Increase = ((New Value – Original Value) / Original Value) * 100%
Illustrative Examples
Let’s solidify this with a couple of money-related examples:
Example 1: Salary Increase
Imagine your annual salary increased from $50,000 to $55,000.
- Difference: $55,000 – $50,000 = $5,000
- Divide by Original: $5,000 / $50,000 = 0.10
- Multiply by 100: 0.10 * 100% = 10%
Your salary increased by 10%.
Example 2: Investment Growth
You invested $1,000 in a stock, and it grew to $1,250 over a year.
- Difference: $1,250 – $1,000 = $250
- Divide by Original: $250 / $1,000 = 0.25
- Multiply by 100: 0.25 * 100% = 25%
Your investment saw a 25% increase.
These examples highlight how the percentage increase provides a clear, standardized way to understand growth, regardless of the absolute numbers involved. A $5,000 salary increase feels significant, but expressing it as a 10% increase allows for easier comparison to other financial metrics or economic benchmarks.
Practical Applications in Personal Finance
The percentage increase calculation isn’t just an academic exercise; it’s a practical tool that empowers individuals to gain a firmer grip on their personal financial health. From optimizing investments to managing household budgets, its utility is widespread.
Tracking Investment Growth
One of the most common and critical applications of percentage increase in personal finance is evaluating investment performance.
- Stocks and Mutual Funds: Knowing that your stock value went from $100 to $120 tells you it increased by $20. But calculating a 20% increase ( (($120-$100)/$100)*100% ) allows you to compare its performance against market indices, other investments, or your target rate of return. This is fundamental for making buy, sell, or hold decisions.
- Real Estate: When assessing the appreciation of a property, the percentage increase provides a clear measure of its growth relative to the initial purchase price. If a home bought for $300,000 is now valued at $360,000, that’s a 20% increase, which informs your equity position and potential future investment strategies.
- Retirement Accounts: Monitoring the percentage growth of your 401(k) or IRA year over year helps you determine if you’re on track to meet your retirement goals and adjust your contributions or asset allocation as needed.
Analyzing Budgetary Changes
Budgets are dynamic, and understanding how different categories change over time is crucial for financial control.
- Income Growth: If your monthly income increases from $4,000 to $4,200, calculating the 5% increase ( (($4,200-$4,000)/$4,000)*100% ) helps you understand your improved purchasing power and plan for increased savings or discretionary spending.
- Expense Inflation: Conversely, if your monthly grocery bill jumps from $600 to $650, recognizing that it’s an 8.33% increase ( (($650-$600)/$600)*100% ) highlights areas where you might need to adjust spending habits or look for alternatives. This is particularly important in times of high inflation.
- Savings Rate Improvement: Actively tracking the percentage increase in your savings balance or savings rate (e.g., from 10% to 12% of income saved) provides motivation and a clear metric of progress towards financial independence.
Evaluating Loan and Debt Increases
While we typically focus on percentage increase in a positive light, the same formula helps understand the growth of debt.
- Interest Rate Impact: If a credit card balance increases from $1,000 to $1,020 due to interest, that’s a 2% increase for that period. Understanding this percentage helps you grasp the true cost of borrowing and motivates debt reduction strategies.
- Compound Interest (on Debt): For loans with compounding interest, calculating the percentage increase periodically reveals how quickly debt can accumulate if left unchecked.
Business Finance Scenarios and Strategic Insights
For businesses, calculating percentage increases is not just about tracking growth; it’s a core component of strategic planning, performance evaluation, and investor relations. It provides a standardized language for discussing financial health and trajectory.
Measuring Revenue and Sales Growth
One of the most fundamental indicators of business health is its ability to generate revenue.
- Quarter-over-Quarter (QoQ) and Year-over-Year (YoY) Analysis: Businesses constantly compare current period sales to previous periods. A 15% YoY increase in sales revenue signals healthy expansion and market penetration, while a lower percentage might prompt a review of marketing strategies or product offerings. For instance, if Q1 sales were $1M and Q2 sales were $1.2M, that’s a 20% QoQ increase, a crucial metric for operational planning.
- Customer Acquisition Growth: Tracking the percentage increase in new customers acquired provides insight into the effectiveness of marketing campaigns and sales efforts.
- Average Transaction Value Growth: An increase in the average amount customers spend per transaction indicates successful upselling or cross-selling initiatives.
Assessing Profit Margin Improvements
Beyond just top-line revenue, businesses need to understand how efficiently they convert sales into profit.
- Gross Profit Margin Increase: If a company’s gross profit (revenue minus cost of goods sold) increases from 30% to 35% of revenue, it signifies improved efficiency in production or favorable pricing adjustments. This isn’t a percentage increase between two numbers in the same direct way as revenue, but the underlying revenue and cost figures are used to calculate the percentage point increase in the margin. If actual gross profit went from $300,000 to $350,000 on the same revenue, that’s a 16.67% increase in gross profit dollars.
- Net Profit Growth: The ultimate measure of profitability, net profit (after all expenses, including taxes), is closely scrutinized. A significant percentage increase in net profit often reflects strong operational management, cost control, or effective tax strategies. For example, a net profit climbing from $100,000 to $130,000 represents a 30% increase, which would be highly attractive to investors.
Understanding Inflation and Market Growth
Businesses operate within broader economic contexts, making it crucial to understand macro trends.
- Impact of Inflation: Businesses need to account for the percentage increase in the cost of raw materials, labor, and utilities. This directly impacts pricing strategies and profit margins. If input costs rise by 8%, the business must consider how to absorb or pass on that increase.
- Market Share Growth: By comparing their sales increase percentage to the overall market growth percentage, businesses can determine if they are gaining, losing, or maintaining market share. If the market grew by 10% and your company grew by 15%, you’ve successfully increased your market share.
Common Pitfalls and Advanced Considerations
While the core calculation is simple, there are nuances and common mistakes that can lead to misinterpretations. Being aware of these can significantly enhance the accuracy and insight derived from your calculations.
Misinterpreting the Base Value
The most frequent error is incorrectly identifying the “Original Value.” Always ensure you are dividing by the starting number, the reference point from which the growth occurred. Forgetting this can lead to completely skewed results. For instance, if something decreases by 20% then increases by 20%, it does not return to its original value if you base the increase on the reduced value.
Dealing with Negative Numbers (Percentage Decrease)
While this article focuses on increase, the same formula can be adapted for a percentage decrease. If the new value is less than the original value, the difference will be negative, resulting in a negative percentage – indicating a decrease.
- Percentage Decrease = ((New Value – Original Value) / Original Value) * 100%
- Example: A stock drops from $100 to $80.
- (($80 – $100) / $100) * 100% = (-$20 / $100) * 100% = -0.20 * 100% = -20%. This is a 20% decrease.
Understanding both increase and decrease using a consistent formula makes financial analysis more robust.
Compounded Growth vs. Simple Growth
For longer-term financial analysis, especially in investments, distinguishing between simple and compounded growth is critical.
- Simple Growth: A single percentage increase calculated over a period. This is what we’ve primarily discussed.
- Compounded Growth: When the growth itself earns further growth. This is the “interest on interest” effect. If an investment grows 10% each year for three years, it’s not simply a 30% increase overall. The base for the 10% growth in year two includes the year one gain, and so on. Understanding compound annual growth rate (CAGR) is essential for evaluating long-term financial products and investments like retirement accounts. While the basic percentage increase formula gives you a single period change, CAGR utilizes it repeatedly to show annual average growth over multiple periods.
Using Financial Tools
While manual calculation is good for understanding, for complex scenarios or large datasets, financial tools become indispensable.
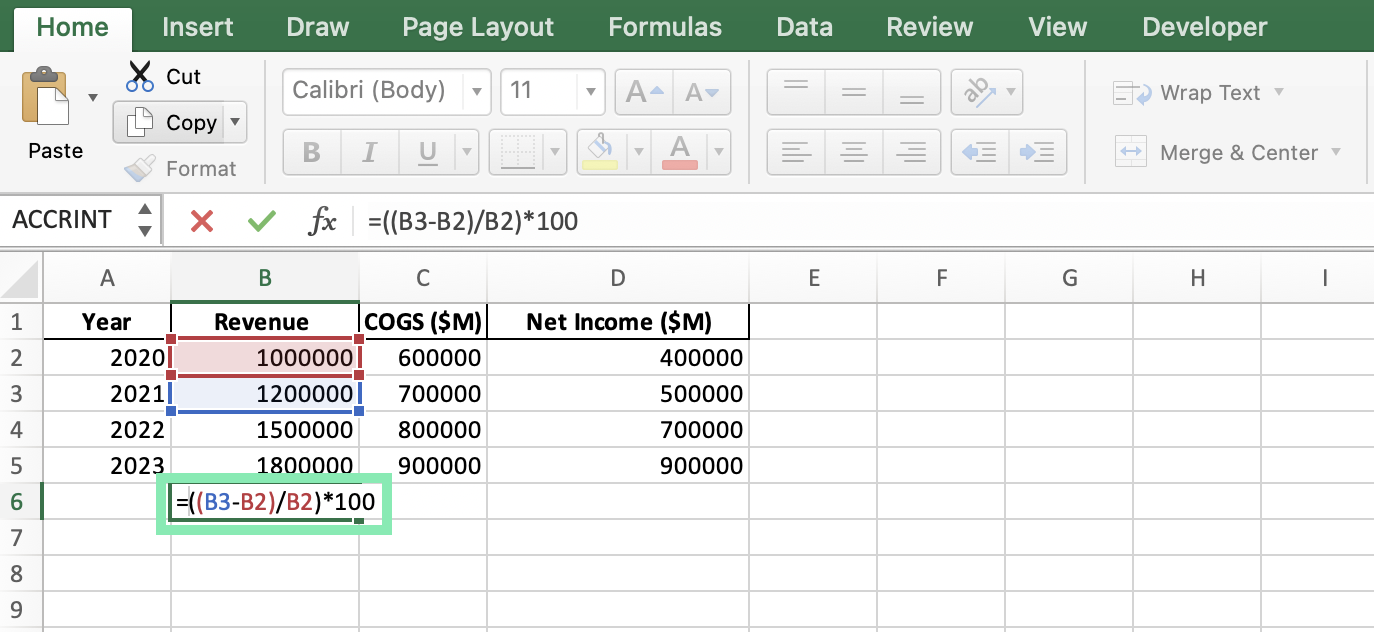
- Spreadsheets (Excel, Google Sheets): These are powerful for automating percentage increase calculations. You can set up formulas (e.g.,
=(B2-A2)/A2then format as a percentage) to quickly analyze hundreds or thousands of data points. This is particularly useful for budget tracking, investment portfolio analysis, and business financial reporting. - Online Calculators: Numerous websites offer simple percentage increase calculators, useful for quick checks.
Mastering Financial Literacy Through Percentage Increases
The ability to calculate and interpret a percentage increase between two numbers is far more than a mathematical trick; it’s a cornerstone of financial literacy. It empowers individuals and businesses to navigate the monetary landscape with greater clarity and confidence.
Informed Decision-Making
Understanding these calculations allows you to:
- Evaluate Opportunities: Is an investment’s projected return truly attractive after considering its percentage increase?
- Identify Trends: Are your expenses increasing at an unsustainable rate? Is your income growing fast enough to outpace inflation?
- Compare Options: Which loan offers a lower percentage increase in overall cost? Which saving account provides a better percentage yield?
Setting Realistic Financial Goals
Whether you’re aiming to grow your savings by 15% this year, increase your business revenue by 20% next quarter, or reduce your debt by 5% each month, these goals become concrete and measurable when expressed as percentages. This quantification allows for systematic progress tracking and adjustments.
Communicating Financial Performance Effectively
In personal discussions, professional presentations, or investor reports, expressing changes as percentages is universally understood and impactful. Saying “My portfolio grew by 15%” is much more concise and informative than “My portfolio grew from $10,000 to $11,500.” It allows for easy comparison across different scales and timeframes.
In conclusion, the percentage increase calculation is a fundamental skill in the money world. It transforms raw numbers into meaningful insights, enabling better control over personal finances, smarter investment choices, and more effective business strategies. By mastering this simple yet profound tool, you equip yourself to make more informed decisions, articulate financial performance with precision, and ultimately, build a more secure and prosperous financial future.
aViewFromTheCave is a participant in the Amazon Services LLC Associates Program, an affiliate advertising program designed to provide a means for sites to earn advertising fees by advertising and linking to Amazon.com. Amazon, the Amazon logo, AmazonSupply, and the AmazonSupply logo are trademarks of Amazon.com, Inc. or its affiliates. As an Amazon Associate we earn affiliate commissions from qualifying purchases.