The question “how did the S&P do today?” is perhaps one of the most frequently asked in financial circles, resonating from individual investors checking their retirement accounts to seasoned portfolio managers adjusting their strategies. On the surface, it’s a simple query seeking a straightforward answer: up, down, or flat, and by how much. Yet, beneath this seemingly simple question lies a complex tapestry of economic forces, corporate performance, geopolitical events, and market sentiment, all converging to dictate the daily dance of the Standard & Poor’s 500 index.
Understanding the S&P 500’s daily performance is far more than just knowing a percentage change. It’s about grasping its significance as a barometer for the broader U.S. economy, recognizing the drivers behind its movements, and most importantly, interpreting what those movements mean – or don’t mean – for personal financial planning and investment decisions. In a world saturated with instant information, the temptation to react to every tick of the market is strong. However, true financial wisdom often lies in discerning signal from noise, especially when looking at the daily fluctuations of a major index. This article delves into the intricacies of the S&P 500’s daily performance, offering a professional, insightful, and engaging perspective on what drives it, how to interpret it, and its broader implications for your financial journey.
Decoding the S&P 500: A Market Barometer
The S&P 500 is not just a collection of stocks; it’s a meticulously constructed index designed to be a leading indicator of the U.S. stock market and, by extension, the health of the American economy. Its daily performance is therefore observed globally as a critical data point.
What is the S&P 500 and Why Does it Matter?
At its core, the S&P 500 is a stock market index that tracks the performance of 500 of the largest publicly traded companies in the United States, selected by S&P Dow Jones Indices. These aren’t just any 500 companies; they are chosen based on criteria like market size, liquidity, public float, and sector representation, ensuring they are truly representative of the U.S. economy. Unlike the Dow Jones Industrial Average, which is price-weighted, the S&P 500 is market-capitalization-weighted. This means that companies with larger market values (share price multiplied by the number of outstanding shares) have a greater impact on the index’s overall movement. For instance, a small percentage move in Apple or Microsoft, given their enormous market caps, will exert more influence on the S&P 500 than a larger percentage move in a smaller constituent company.
The significance of the S&P 500 cannot be overstated. It represents approximately 80% of the total value of the U.S. stock market, making it an unparalleled benchmark for professional investors and a proxy for the entire market’s performance. When financial news outlets report on “the market” moving up or down, they are almost invariably referring to the S&P 500. For individual investors, mutual funds, and exchange-traded funds (ETFs) that aim to mirror the broader market, the S&P 500 is the standard against which their performance is measured. Its health often reflects corporate profitability, consumer confidence, and the overall economic sentiment of the nation.
Beyond the Ticker: Understanding Market Capitalization
The market-cap weighting methodology of the S&P 500 is crucial for understanding its dynamics. It means that the index is heavily influenced by a relatively small number of mega-cap companies, particularly those in the technology sector that have seen exponential growth in recent decades. Companies like Apple, Microsoft, Amazon, Alphabet (Google), and Nvidia often comprise a significant portion of the index’s total weight. This concentration can lead to scenarios where the strong performance of a few tech giants can mask weaker performance across a broader swathe of smaller companies within the index, or vice-versa.
For investors, this weighting implies that their exposure to the S&P 500 index through a fund means they are inherently more exposed to the fortunes of these larger companies. While this has often been beneficial given the growth trajectories of these firms, it also concentrates risk. Understanding this nuance allows investors to look beyond the headline number and appreciate the underlying composition that drives the index’s daily gyrations.
The Daily Drivers: What Moves the Market?
The S&P 500’s daily performance is a confluence of numerous factors, each vying for influence. Pinpointing a single cause for a given day’s movement is often simplistic; it’s usually a complex interplay.
Macroeconomic Ripples: Inflation, Interest Rates, and Employment
Broad economic data plays a paramount role. Reports on inflation (Consumer Price Index, Producer Price Index), employment (non-farm payrolls, unemployment rate), Gross Domestic Product (GDP), and consumer confidence can send immediate shockwaves through the market. Strong employment numbers, for example, might suggest a robust economy, typically positive for corporate earnings. However, if they also signal rising inflation, they might lead investors to anticipate interest rate hikes by the Federal Reserve, which can be a negative for equity valuations. Conversely, weak economic data could suggest a recession, leading to a market downturn, but might also lead the Fed to consider lowering rates or pausing hikes, which could provide a boost. The market is constantly weighing current data against future expectations.
Corporate Catalysts: Earnings, Guidance, and Sector Performance
A significant driver of daily movements comes from the companies themselves. Quarterly earnings reports, especially from the S&P 500’s largest constituents, can dramatically shift the index. A company reporting better-than-expected earnings or providing optimistic future guidance can see its stock soar, lifting the entire index with it. Conversely, a miss or a cautious outlook can trigger a sell-off. Beyond individual company news, sector-specific trends can also influence the S&P 500. For example, a surge in oil prices might benefit energy companies but hurt airlines and consumers, creating a mixed impact that still contributes to the overall index movement. The collective health and outlook of the 500 companies are a direct reflection of the index’s performance.
Geopolitical Currents and Global Sentiment
The interconnectedness of the global economy means that events far from Wall Street can have a profound impact on the S&P 500. Geopolitical tensions, such as conflicts, trade disputes, or political instability in major economic regions, can trigger uncertainty and risk aversion, leading investors to pull back from equities. Similarly, significant economic shifts or policy changes in other major economies like China or Europe can affect global supply chains, corporate profitability, and investor sentiment, indirectly influencing the U.S. market. The S&P 500, despite being a U.S.-centric index, is not immune to the broader currents of international affairs and global sentiment.
The Federal Reserve’s Guiding Hand
Perhaps one of the most consistently impactful drivers of the S&P 500 is the Federal Reserve. The Fed’s monetary policy decisions, particularly regarding interest rates (the federal funds rate), quantitative easing or tightening, and its forward guidance, are intensely scrutinized by the market. Higher interest rates typically make borrowing more expensive for businesses and consumers, potentially slowing economic growth and reducing corporate profits, which can weigh on stock prices. Conversely, lower rates can stimulate economic activity and boost equity valuations. Every statement from the Fed Chair, every meeting minutes release, and every interest rate decision is parsed for clues about future policy, often causing immediate and significant market reactions. The market attempts to “price in” anticipated Fed actions, but unexpected shifts can lead to pronounced daily volatility.
Interpreting “Today’s” Performance: Noise, Signal, or Trend?
With so many variables at play, determining the true significance of a single day’s S&P 500 performance requires a nuanced perspective, moving beyond knee-jerk reactions.
The Illusion of Short-Term Significance
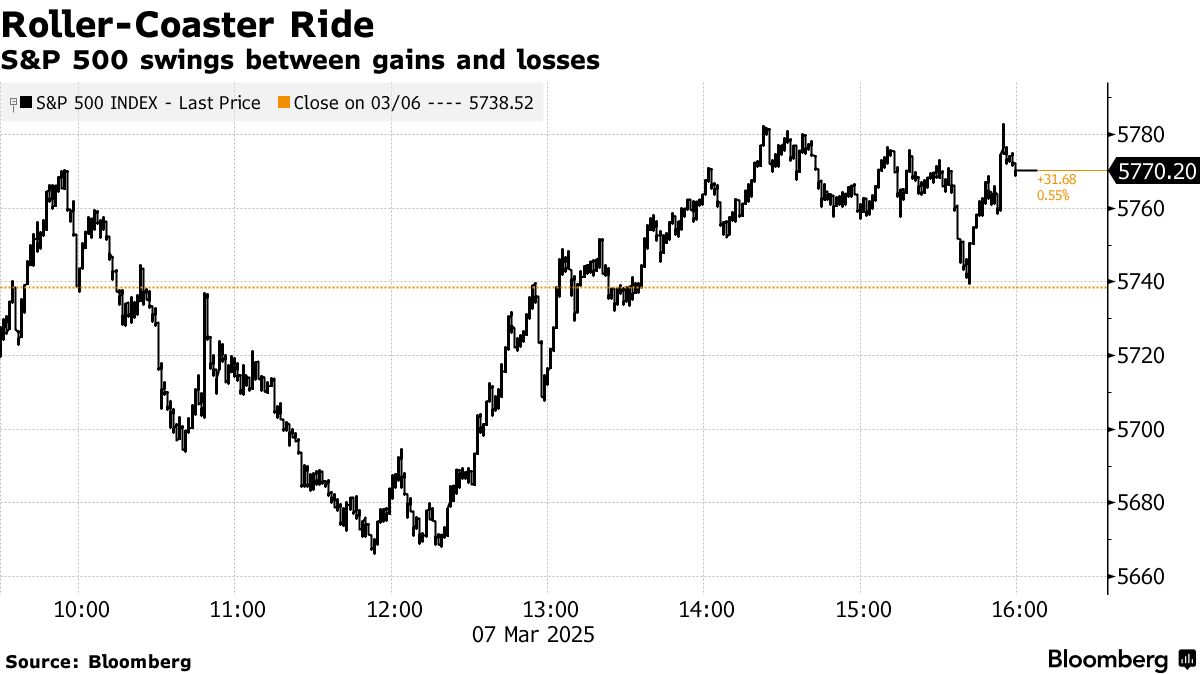
A single day’s movement in the S&P 500, whether up by 1% or down by 1.5%, rarely tells the whole story. The market is inherently volatile in the short term, influenced by fleeting headlines, algorithmic trading, and the collective psychology of millions of participants. Attaching profound significance to a single trading session can be misleading. Many seasoned investors refer to daily movements as “noise” – random fluctuations that distract from the underlying, longer-term economic and corporate fundamentals. Reacting emotionally to daily swings, such as panic-selling on a down day or chasing gains on an up day, is a common pitfall that often leads to suboptimal investment outcomes. It’s crucial to remember that financial markets are designed for the accumulation of wealth over time, not for daily gambling.
Contextualizing Daily Swings: Broader Trends and Historical Perspective
Instead of fixating on “today,” a more insightful approach involves contextualizing daily performance within broader trends. Is today’s movement an anomaly, or does it fit within a weekly, monthly, or quarterly pattern? Is the market breaking through a significant resistance level, or bouncing off a support level? Observing the S&P 500’s moving averages (e.g., 50-day, 200-day) can provide a clearer picture of its trajectory. A 1% dip today might be negligible if the index has gained 10% over the last month, just as a 0.5% gain might be insignificant if the overall trend is sharply down.
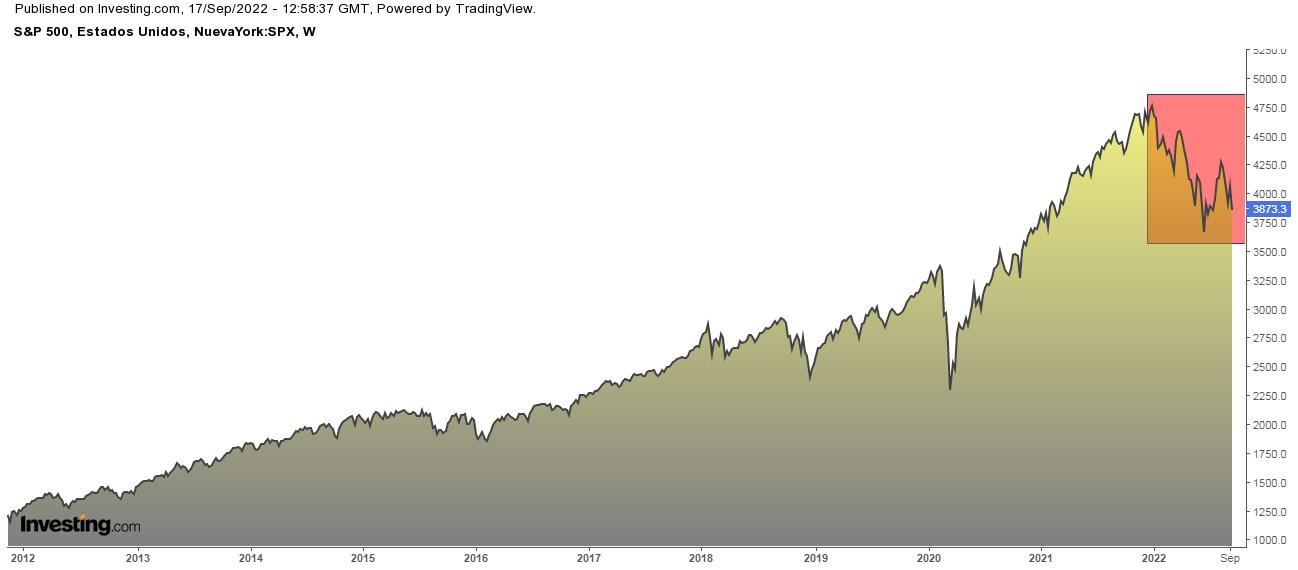
Furthermore, historical perspective is vital. The S&P 500 has, over decades, consistently delivered positive returns despite numerous crises, recessions, and daily volatilities. Understanding this long-term upward bias, driven by economic growth and corporate innovation, helps put daily fluctuations into their proper context. It reinforces the idea that temporary downturns are often opportunities for long-term investors, rather than reasons for panic.
Tools for Real-Time Tracking and Analysis
For those who wish to track the S&P 500’s performance, numerous tools are available. Financial news websites (e.g., Bloomberg, Reuters, Wall Street Journal), investment platforms (e.g., Fidelity, Schwab), and dedicated market data providers offer real-time quotes, charts, and analytical tools. These resources often provide not only the current percentage change but also volume data, sector breakdowns, and news headlines that might be influencing the market. However, it’s essential to use these tools for informed understanding, not for reactive decision-making. Setting up watchlists and alerts can help monitor significant movements without the need for constant, anxiety-inducing checks.
Implications for Your Portfolio: Beyond a Single Day’s Close
Ultimately, how the S&P 500 performs “today” has different implications depending on your investment horizon and strategy.
For the Long-Term Investor: Staying the Course
For the vast majority of investors saving for retirement, a child’s education, or other long-term goals, “today’s” S&P 500 performance should rarely dictate action. Long-term investing thrives on patience and consistency. Market downturns, when viewed through a multi-decade lens, are often seen as temporary dips on an upward trajectory. Attempting to time the market – jumping in and out based on daily movements – is notoriously difficult and often leads to missing out on significant gains or locking in losses. A disciplined strategy, such as dollar-cost averaging (investing a fixed amount regularly, regardless of market conditions), can effectively mitigate the impact of short-term volatility. The focus should be on asset allocation, diversification, and consistent contributions, rather than reacting to daily news.
For the Active Trader: Navigating Volatility
For active traders with shorter time horizons, daily S&P 500 movements are critical. These individuals or institutions aim to profit from short-term price fluctuations using sophisticated analysis, trading algorithms, and risk management strategies. Their decisions might hinge on intra-day charts, technical indicators, and immediate news reactions. While potentially lucrative, active trading is extremely challenging, carries significant risk, and is generally not recommended for the average retail investor due to the time commitment, specialized knowledge, and emotional resilience required. Even for professional traders, risk management and a clear understanding of their edge are paramount.
The Role of Diversification and Risk Management
Regardless of your investment horizon, diversification remains a cornerstone of prudent financial management. While the S&P 500 is diversified across 500 companies and multiple sectors, a truly diversified portfolio might also include international stocks, bonds, real estate, and other asset classes. This helps cushion the blow if the U.S. stock market experiences a severe downturn, as different asset classes often perform differently under various economic conditions. Risk management also involves understanding your personal risk tolerance and ensuring your portfolio allocation aligns with it. A well-constructed portfolio is designed to weather daily storms, not be capsized by them.

Emotional Discipline in Market Fluctuations
Perhaps the greatest lesson from observing the S&P 500’s daily dance is the importance of emotional discipline. Fear and greed are powerful emotions that can cloud judgment and lead to irrational financial decisions. When the market is soaring, there’s a temptation to chase returns; when it’s plummeting, panic can set in, prompting investors to sell at the worst possible time. A professional approach to investing requires setting clear financial goals, establishing a robust investment plan, and sticking to it through market highs and lows. Automated investing, regular portfolio rebalancing, and professional financial advice can all help in maintaining this crucial emotional discipline, ensuring that “today’s” S&P 500 performance doesn’t derail your long-term financial success.
In conclusion, asking “how did the S&P do today?” is a fundamental inquiry into the pulse of the market. While the daily number provides a snapshot, true insight comes from understanding the complex forces that drive it, appreciating the context of its movements, and aligning that understanding with a disciplined, long-term financial strategy. The S&P 500 is a powerful indicator, but it is a guide, not a master, of your financial destiny. Informed decisions, not reactive ones, pave the way to enduring wealth.
aViewFromTheCave is a participant in the Amazon Services LLC Associates Program, an affiliate advertising program designed to provide a means for sites to earn advertising fees by advertising and linking to Amazon.com. Amazon, the Amazon logo, AmazonSupply, and the AmazonSupply logo are trademarks of Amazon.com, Inc. or its affiliates. As an Amazon Associate we earn affiliate commissions from qualifying purchases.