
In the intricate world of financial markets, investors constantly seek robust tools to gauge a company’s true worth and future potential. While historical data provides a comforting anchor, the stock market is inherently forward-looking, its movements often driven by expectations of what’s to come. Among the myriad valuation metrics available, the Price-to-Earnings (P/E) ratio stands as a cornerstone, but a more nuanced variant – the Forward P/E – offers a crucial lens into a company’s anticipated profitability. Understanding Forward P/E is not just about crunching numbers; it’s about making informed decisions that align with future growth prospects and market dynamics. This article will demystify Forward P/E, exploring its mechanics, advantages, limitations, and how it can be strategically integrated into a sound investment approach.
Understanding the Fundamentals: Price-to-Earnings (P/E) Ratio
Before diving into the specifics of Forward P/E, it’s essential to grasp the foundational concept of the traditional P/E ratio, often referred to as Trailing P/E. This metric serves as a primary indicator of how much investors are willing to pay for each dollar of a company’s earnings.
The Basic P/E Ratio: A Snapshot of Current Value
The P/E ratio is calculated by dividing a company’s current share price by its earnings per share (EPS) over the past 12 months. For example, if a stock trades at $50 and its EPS for the last year was $5, the P/E ratio would be 10x. This number offers a quick snapshot, indicating that investors are paying $10 for every $1 of the company’s past earnings. A high P/E typically suggests that investors expect higher earnings growth in the future compared to companies with a lower P/E. Conversely, a low P/E might indicate that a company is undervalued, or that investors anticipate slower growth or even declining earnings. It’s a fundamental metric for comparing companies within the same industry and assessing whether a stock might be overvalued or undervalued relative to its peers.
Limitations of Historical Earnings
While simple and widely used, the traditional (trailing) P/E ratio has a significant drawback: it relies entirely on historical data. The past, as financial analysts often quip, is no guarantee of future results. Companies operate in dynamic environments, influenced by economic cycles, technological disruptions, competitive pressures, and shifts in consumer behavior. A company’s earnings from the last year might not accurately reflect its current trajectory or its projected performance in the coming year. For instance, a company that just underwent a major restructuring or launched a revolutionary product might have a trailing P/E that doesn’t capture the positive impact of these changes. Conversely, a company facing new regulatory hurdles or increased competition might have a trailing P/E that overstates its future profitability. This backward-looking nature is precisely where Forward P/E steps in, offering a more predictive and potentially insightful perspective.
Delving into Forward PE: A Glimpse into Tomorrow’s Earnings
Forward P/E shifts the focus from what a company has earned to what it is expected to earn, providing a critical forward-looking dimension to valuation analysis.
Definition and Calculation of Forward PE
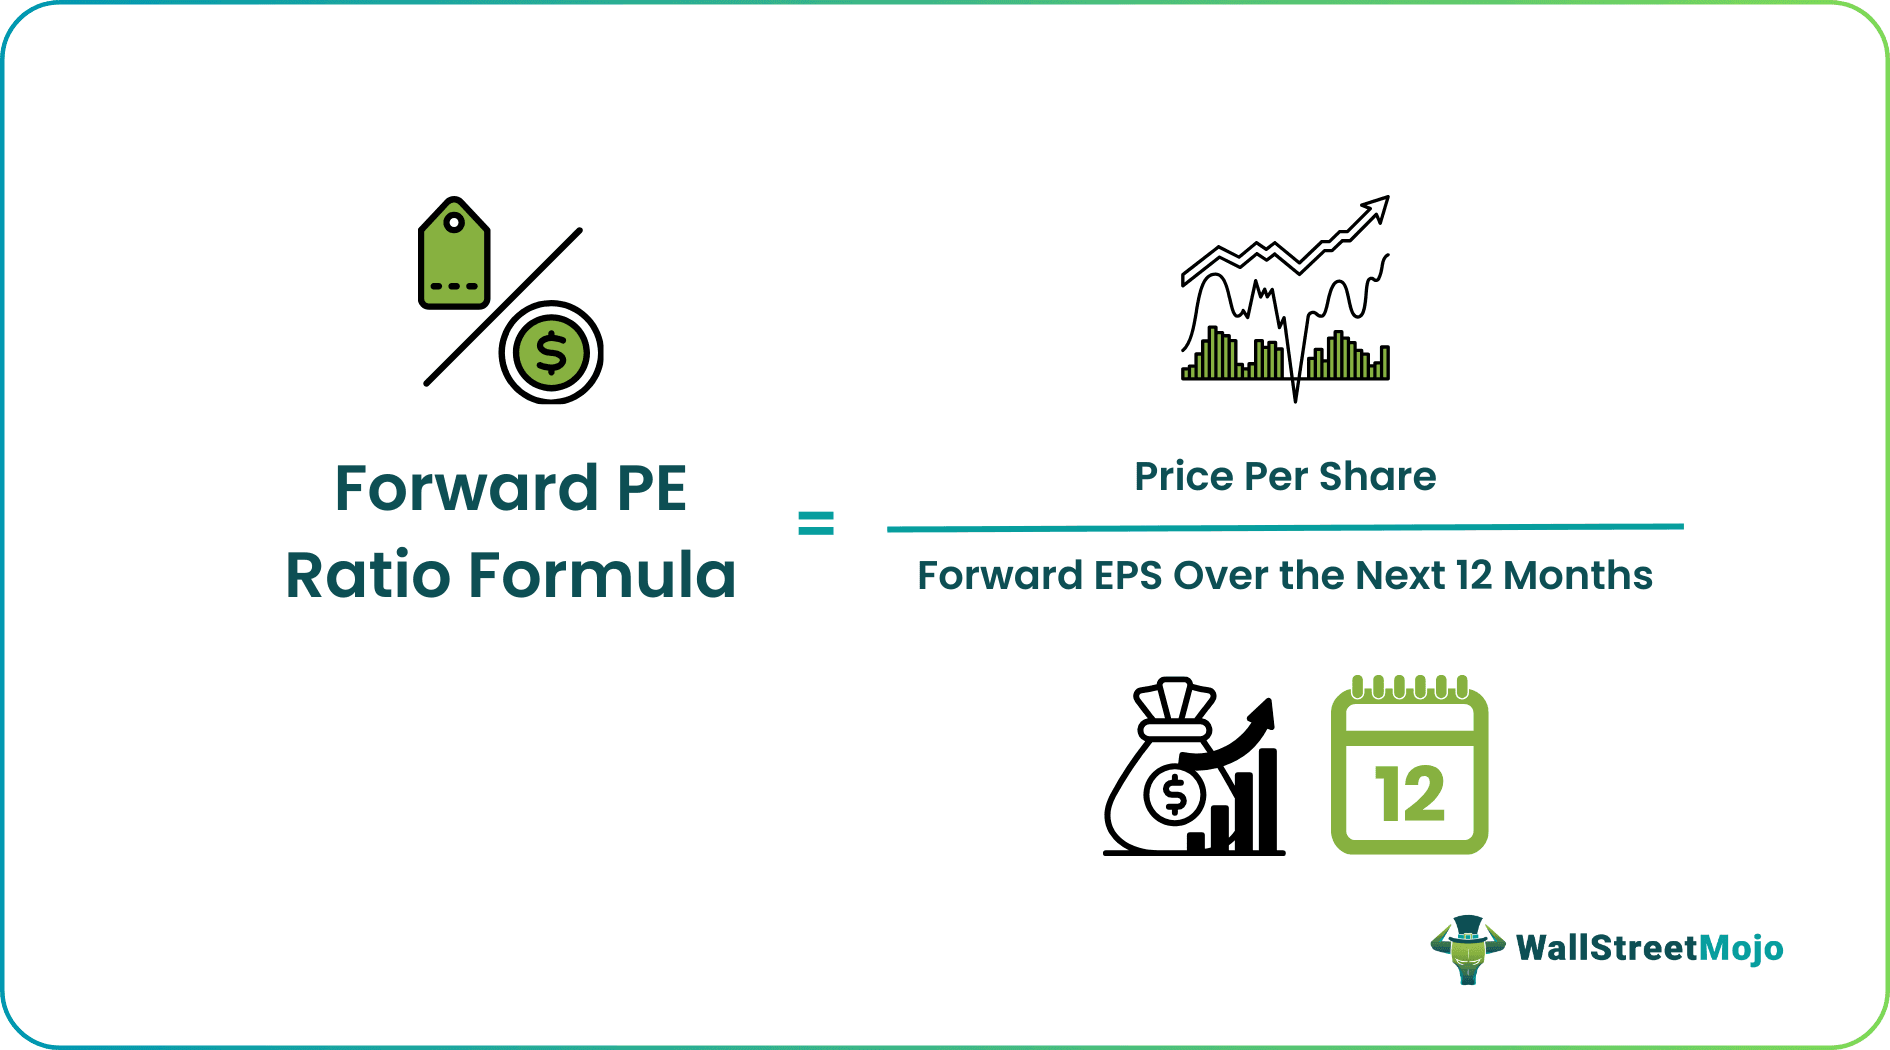
Forward P/E is calculated by dividing the company’s current share price by its estimated future earnings per share (EPS) over the next 12 months.
The formula is straightforward:
Forward P/E = Current Share Price / Estimated Future 12-Month EPS
The key differentiator here is the “estimated future EPS.” These estimates are typically compiled by financial analysts who cover the company, factoring in management guidance, industry trends, economic forecasts, and the company’s specific growth initiatives. These analysts often publish their consensus estimates, which are then widely used by investors and financial platforms. For instance, if a company’s stock is trading at $50, and analysts project its EPS for the coming year to be $6, its Forward P/E would be 8.33x. This suggests that investors are paying $8.33 for every $1 of its anticipated future earnings.
Why Focus on Future Earnings?
The emphasis on future earnings is paramount because stock prices inherently reflect market expectations. Investors buy stocks today based on their belief in the company’s ability to generate profits and grow in the future. A company with strong growth prospects might command a higher Forward P/E, indicating investor confidence in its future earning power. Conversely, a company expected to face headwinds might have a lower Forward P/E, signaling investor skepticism.
Focusing on future earnings allows investors to:
- Anticipate Growth: Identify companies that are poised for significant earnings expansion, even if their recent performance was modest.
- Account for Change: Incorporate the impact of recent events, strategic shifts, or new product launches that haven’t yet been reflected in historical financial statements.
- Make Proactive Decisions: Adjust investment strategies based on evolving expectations rather than being anchored solely to past performance.
Forward PE vs. Trailing PE: Key Distinctions
The fundamental difference between Forward P/E and Trailing P/E lies in the earnings figure used: historical for Trailing P/E and estimated for Forward P/E.
| Feature | Trailing P/E | Forward P/E |
|---|---|---|
| Earnings Source | Actual, reported earnings from the past 12 months | Estimated earnings for the next 12 months |
| Nature | Backward-looking, reflects historical performance | Forward-looking, reflects future expectations |
| Reliability | Based on audited financial statements, highly reliable | Based on analyst estimates, subject to revision |
| Use Case | Baseline valuation, historical comparison | Growth analysis, proactive investment decisions |
| Interpretation | How much investors paid for past earnings | How much investors are willing to pay for future earnings |
While Trailing P/E provides a solid, verifiable baseline, Forward P/E offers a dynamic view, reflecting the market’s collective wisdom (and sometimes speculation) about a company’s path forward. Savvy investors often consider both metrics in tandem to gain a comprehensive understanding. If a company’s Forward P/E is significantly lower than its Trailing P/E, it might suggest that analysts expect substantial earnings growth, making the stock potentially attractive. Conversely, if Forward P/E is higher, it could signal expected earnings decline or merely reflect very aggressive growth projections.
The Strategic Advantages of Using Forward PE
Beyond its basic definition, Forward P/E offers several strategic advantages that make it an indispensable tool for investors seeking to identify value and growth opportunities.

Predictive Power in Valuation
One of the most significant advantages of Forward P/E is its predictive nature. By focusing on anticipated earnings, it allows investors to factor in the potential impact of future events, product pipelines, market expansions, and cost-cutting initiatives that have not yet manifested in reported financial results. This makes it particularly useful for valuing companies in high-growth sectors (like technology or biotech) where current earnings might be low or even negative, but future earnings are expected to explode. It helps investors look beyond the present challenges to the potential rewards down the line.
Identifying Growth Opportunities
Growth investors are particularly fond of Forward P/E because it directly helps in identifying companies with strong growth trajectories. A company with a high Trailing P/E might appear expensive, but if its Forward P/E is considerably lower, it signals that analysts expect robust earnings growth that will ‘catch up’ to the current stock price, making it appear cheaper on a forward-looking basis. This difference highlights potential growth opportunities where the market might be underappreciating future earnings expansion. It allows investors to assess whether the current premium on a stock is justified by its projected earnings trajectory.
Comparing Companies and Industries
Forward P/E is an excellent metric for comparing the relative valuation of companies within the same industry or sector. While absolute P/E values can vary wildly across different industries (e.g., tech companies often have higher P/Es than utility companies), comparing Forward P/Es among peers provides a standardized way to assess which company might be relatively undervalued or overvalued given its growth prospects. For instance, if two software companies have similar Trailing P/Es, but one has a significantly lower Forward P/E, it suggests that the market expects faster future earnings growth from that company, potentially making it a more attractive investment. This comparative analysis is crucial for portfolio construction and sector allocation decisions.
Navigating the Nuances: Challenges and Considerations
Despite its numerous benefits, Forward P/E is not without its limitations and potential pitfalls. Investors must approach it with a critical eye, understanding that it relies on projections, which are inherently uncertain.
The Reliability of Earnings Estimates
The primary challenge with Forward P/E stems from the reliability of the “E” – the estimated future earnings. These estimates are produced by financial analysts, who, despite their expertise, can be wrong. Projections are based on assumptions about future economic conditions, market trends, competitive landscapes, and company-specific performance. Any deviation from these assumptions can render the estimates inaccurate. For instance, an unexpected economic downturn, a new competitor entering the market, or a change in consumer preferences can significantly impact a company’s actual earnings, making the initial Forward P/E calculation misleading. Investors should be aware of the range of analyst estimates and the potential for bias, as analysts may sometimes be overly optimistic or pessimistic.
Sensitivity to Economic Conditions
Forward P/E ratios are highly sensitive to changes in economic outlook. During periods of economic expansion, analysts tend to be more optimistic, leading to higher earnings estimates and potentially lower Forward P/E ratios (making stocks look cheaper). Conversely, during economic downturns or periods of uncertainty, estimates tend to be revised downwards, leading to higher Forward P/E ratios (making stocks look more expensive) even if the stock price remains constant. This sensitivity means that Forward P/E can be a moving target, requiring continuous monitoring and adjustment based on evolving macroeconomic indicators and company-specific news. Relying solely on a static Forward P/E without considering the broader economic context can lead to flawed investment conclusions.
Not a Standalone Metric
No single financial metric, including Forward P/E, should be used in isolation for investment decisions. Forward P/E offers a valuable perspective on future earnings, but it doesn’t tell the whole story. It doesn’t account for a company’s debt levels, cash flow generation, asset base, management quality, competitive moat, or broader market risks. A company might have an attractive Forward P/E but be saddled with unsustainable debt, weak free cash flow, or poor corporate governance. Therefore, Forward P/E must be integrated into a holistic valuation framework that considers a wide array of financial health indicators and qualitative factors. It serves as one crucial piece of a larger, more complex puzzle.
Integrating Forward PE into Your Investment Strategy
To leverage Forward P/E effectively, investors need a methodical approach that combines it with other tools and maintains a forward-looking perspective.
Combining with Other Valuation Metrics
The most effective way to use Forward P/E is in conjunction with other valuation metrics and financial analysis tools.
- Trailing P/E: Compare Forward P/E with Trailing P/E to understand the market’s expectation of earnings growth or contraction.
- PEG Ratio (Price/Earnings to Growth): The PEG ratio (P/E divided by the earnings growth rate) incorporates growth into the P/E analysis. A lower PEG ratio (ideally below 1) often indicates a potentially undervalued stock relative to its growth prospects. Using Forward P/E in the PEG ratio provides an even more predictive measure.
- EV/EBITDA: Enterprise Value to Earnings Before Interest, Taxes, Depreciation, and Amortization (EV/EBITDA) is particularly useful for capital-intensive industries or companies with high depreciation, offering a clearer picture of operational profitability and taking debt into account.
- Dividend Yield: For income-focused investors, combining Forward P/E with dividend yield can provide insights into both growth potential and income generation.
- Discounted Cash Flow (DCF): For a deeper, intrinsic valuation, Forward P/E can serve as a sanity check or an input into a DCF model, which projects future cash flows and discounts them back to their present value.
By cross-referencing these metrics, investors can build a more robust and nuanced understanding of a company’s valuation and potential risks.
Practical Application for Investors
For practical application, investors should:
- Scrutinize Analyst Estimates: Don’t just take analyst estimates at face value. Understand the underlying assumptions. Look at the range of estimates rather than just the consensus, and consider the track record of the analysts providing them.
- Compare Within Industry: Always compare a company’s Forward P/E to its industry peers and the broader market average. This contextualization is vital for determining relative attractiveness.
- Consider Growth Rates: A high Forward P/E might be justified for companies with exceptionally high expected earnings growth. Conversely, a low Forward P/E might still be too high if earnings are expected to decline significantly.
- Look for Consistency: Examine the consistency of earnings estimates over time. Frequent and drastic revisions might signal volatility or uncertainty in the company’s business outlook.
- Factor in Qualitative Aspects: Remember that financials are only part of the story. Management quality, competitive advantages (moats), brand strength, innovation pipeline, and regulatory environment are all crucial qualitative factors that influence future earnings and should inform your overall investment thesis.

Continuous Monitoring and Adaptation
The financial markets are constantly evolving, and so too are earnings estimates. Forward P/E is not a static metric; it requires continuous monitoring. As new information emerges, earnings estimates are revised, and stock prices fluctuate, the Forward P/E ratio will change. Investors should regularly revisit their analyses, especially after quarterly earnings reports, management guidance updates, and significant macroeconomic news. An investment thesis built on a specific Forward P/E today might need adjustment tomorrow. This dynamic approach ensures that investment decisions remain aligned with the most current and relevant future expectations.
In conclusion, Forward P/E is an indispensable tool for investors who wish to look beyond historical performance and assess a company’s potential based on its anticipated future earnings. While its reliance on estimates introduces an element of uncertainty, when used judiciously and in conjunction with other robust financial metrics, it provides a powerful, forward-looking perspective that can significantly enhance the quality of investment decisions and unlock future value in dynamic markets.
aViewFromTheCave is a participant in the Amazon Services LLC Associates Program, an affiliate advertising program designed to provide a means for sites to earn advertising fees by advertising and linking to Amazon.com. Amazon, the Amazon logo, AmazonSupply, and the AmazonSupply logo are trademarks of Amazon.com, Inc. or its affiliates. As an Amazon Associate we earn affiliate commissions from qualifying purchases.