
Every day, as the trading sessions conclude across the globe, millions of investors, analysts, and news outlets turn their attention to a seemingly simple question: “What did the stock market close at?” While it might appear to be a straightforward query seeking a numerical answer, the daily closing price of market indices and individual stocks is far more than just a data point. It represents the culmination of countless transactions, a snapshot of collective investor sentiment, economic expectations, and reactions to geopolitical events. For anyone engaged in personal finance, investing, or even simply observing the health of the economy, understanding the significance of these closing figures is paramount. It’s a critical piece of the puzzle that helps piece together market trends, assess portfolio performance, and inform future financial decisions, moving far beyond mere curiosity to become a vital signal in the complex world of capital markets.
The Daily Ritual: Why Closing Prices Matter
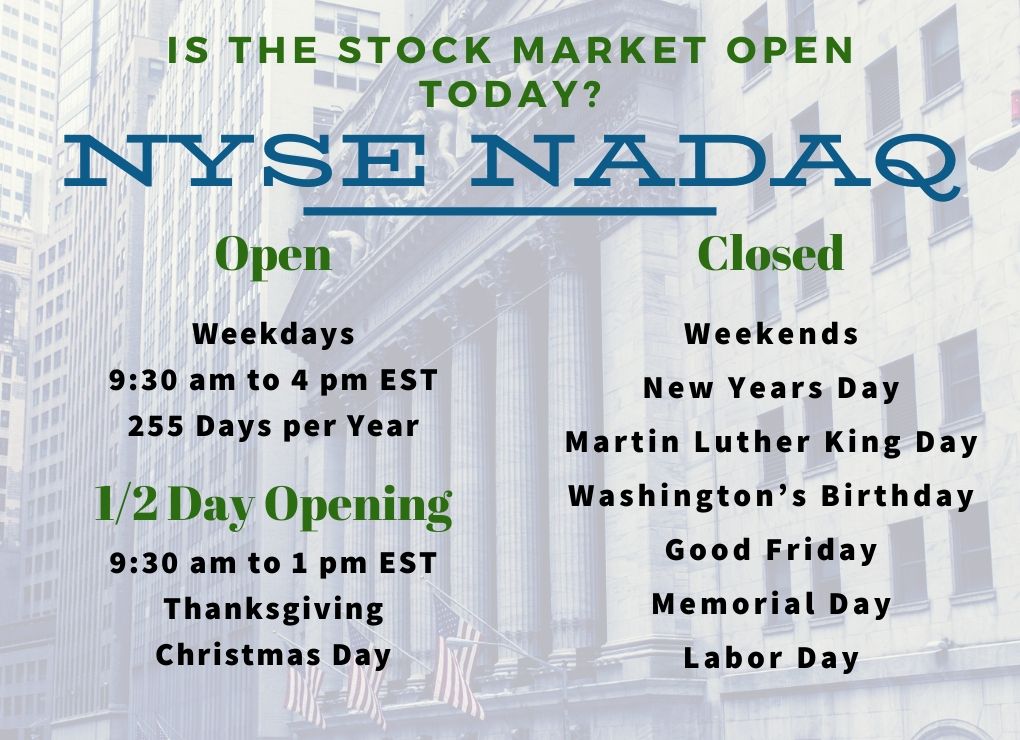
The moment the closing bell rings, signaling the end of regular trading hours, marks a pivotal event for financial markets worldwide. This isn’t just an arbitrary endpoint; it’s a moment pregnant with meaning, offering a consolidated view of the day’s financial narrative. The closing price of an index or a stock isn’t merely the last price at which a transaction occurred; it’s often a volume-weighted average of trades executed around the market close, designed to provide a fair and representative value. For many, it’s the definitive answer to how their investments performed that day, reflecting everything from micro-level company news to macro-economic shifts.
More Than Just a Number: The Significance of the Close
The closing price holds multifaceted importance. For active traders, it sets the stage for overnight positions and influences pre-market and after-hours trading strategies. For long-term investors, while less focused on daily fluctuations, the closing price contributes to their cumulative portfolio returns and informs strategic rebalancing decisions. Beyond individual portfolios, these figures are a primary gauge of market sentiment. A strong close, especially after a volatile day, can signal underlying resilience or renewed optimism, while a weak close might suggest growing caution or bearish sentiment. Financial news anchors and newspaper headlines invariably lead with the day’s closing numbers, shaping public perception and influencing the broader economic discourse. This daily ritual, therefore, is crucial for assessing market health, evaluating investment strategies, and understanding the general economic mood.
Key Market Indices: Tracking the Pulse of the Economy
When we ask “what did the stock market close at,” we are usually referring to the performance of major market indices. These indices are carefully constructed baskets of stocks designed to represent a specific segment of the market or the economy as a whole. The most widely followed in the U.S. include:
- Dow Jones Industrial Average (DJIA): Comprising 30 large, publicly owned companies, it’s often seen as a barometer of the overall U.S. stock market and economy. Its price-weighted average means high-priced stocks have a greater impact.
- S&P 500 (Standard & Poor’s 500): Consisting of 500 of the largest U.S. publicly traded companies, it’s widely regarded as the best gauge of large-cap U.S. equities and a proxy for the broader economy. It is market-capitalization-weighted, meaning larger companies have more influence.
- Nasdaq Composite: Heavily weighted towards technology and growth companies, this index tracks all common equities listed on the Nasdaq stock market. Its performance is often indicative of innovation and investor appetite for riskier, high-growth sectors.
Each index provides a distinct lens through which to view market performance. A strong close across these indices often signals widespread investor confidence, while divergent performance might point to specific sector trends or underlying economic shifts. Globally, indices like the FTSE 100 (UK), Nikkei 225 (Japan), DAX (Germany), and Hang Seng (Hong Kong) serve similar functions for their respective regions, demonstrating the interconnectedness of global financial markets.
The Closing Bell: A Snapshot in Time
The closing bell itself is a highly symbolic moment, but the actual process of determining the closing price is more nuanced than simply taking the last trade. Many exchanges use a “closing auction” mechanism, where all orders entered around the close are aggregated and executed at a single price designed to maximize executed volume. This helps to prevent manipulation by single large trades right at the end of the day and ensures a fair representation of supply and demand. This official closing price then serves as the reference point for calculating daily gains or losses, settling derivative contracts, and marking portfolios to market. It is this consolidated and authenticated figure that permeates financial reports and news cycles, solidifying its role as the day’s definitive market statement.
Decoding the Numbers: Factors Influencing Daily Closes
The journey from the market’s opening to its close is a dynamic interplay of countless forces, each capable of swaying prices and ultimately dictating the day’s final figures. Understanding these underlying drivers is essential for anyone trying to move beyond simply knowing “what did the stock market close at” to comprehending why it closed there. These factors range from hard economic data to intangible investor psychology, demonstrating the multifaceted nature of financial markets.
Economic Indicators and Corporate Earnings
At the foundational level, macroeconomic data and corporate performance reports are powerful determinants. Positive news regarding Gross Domestic Product (GDP) growth, declining unemployment rates, or contained inflation can fuel optimism, leading to higher stock prices. Conversely, signs of economic contraction, rising job losses, or surging inflation can trigger sell-offs. Similarly, individual corporate earnings reports are critical. A company reporting stronger-than-expected profits or issuing an optimistic outlook can see its stock surge, pulling sector peers along, while a disappointing report can lead to sharp declines. These announcements, especially from bellwether companies, often have ripple effects across entire indices.
Geopolitical Events and Global News
The interconnectedness of the global economy means that events far beyond national borders can significantly impact domestic stock markets. Geopolitical tensions, such as trade wars, military conflicts, or political instability in key regions, often inject uncertainty and fear into markets, leading to sell-offs. Conversely, peace agreements or diplomatic resolutions can spark rallies. Major global news events, including pandemics, natural disasters, or significant technological breakthroughs, can also have profound and immediate effects on market sentiment and asset valuations, often resulting in swift and dramatic shifts in closing prices.
Investor Sentiment and Market Psychology
Beyond tangible data, the psychological state of the market, known as investor sentiment, plays a crucial role. Fear and greed are powerful emotions that can drive irrational exuberance or panic selling. News cycles, social media trends, and even technical analysis patterns can feed into this collective psychology. A market driven by herd mentality might see trends amplify, regardless of underlying fundamentals, leading to extended rallies or prolonged downturns. Understanding the prevailing sentiment, whether bullish (optimistic) or bearish (pessimistic), is key to interpreting daily closes. Technical analysts often use daily closing prices to identify support and resistance levels, candlestick patterns, and other indicators that reveal shifts in market psychology.
Interest Rates and Central Bank Policies
The monetary policies enacted by central banks, most notably the U.S. Federal Reserve, are arguably one of the most significant long-term drivers of market performance. Decisions regarding interest rates directly impact borrowing costs for businesses and consumers, influencing corporate profitability, investment, and spending. A hawkish stance (raising rates to curb inflation) can make bonds more attractive relative to stocks and increase the cost of capital, potentially dampening stock market performance. Conversely, a dovish stance (lowering rates to stimulate growth) can make stocks more appealing and reduce borrowing costs, often leading to market rallies. Central bank pronouncements, such as those following Federal Open Market Committee (FOMC) meetings, are dissected minute-by-minute by traders, with the outcomes frequently causing significant market volatility that shapes the day’s closing figures.
Accessing and Interpreting Closing Data
In today’s digital age, obtaining real-time and historical stock market closing data is easier than ever. However, merely looking at the numbers isn’t enough; true value lies in understanding how to interpret them and where to find reliable information. For anyone focused on money and investing, discerning the quality and context of market data is as important as the data itself.
Reliable Sources for Market Data
To answer “what did the stock market close at” accurately, it’s crucial to rely on reputable sources. These platforms often provide not just the closing price but also volume, daily highs and lows, and historical data, offering a comprehensive view of market activity:
- Financial News Websites: Major outlets like Bloomberg, Reuters, Wall Street Journal, Financial Times, and Yahoo Finance offer comprehensive market summaries, often with interactive charts and in-depth analysis.
- Brokerage Platforms: If you have an investment account, your brokerage’s platform (e.g., Fidelity, Schwab, E*TRADE, Vanguard) typically provides detailed market data, often integrated with your portfolio performance.
- Official Exchange Websites: Websites for exchanges like the New York Stock Exchange (NYSE) or Nasdaq provide authoritative data directly from the source.
- Google Finance/Other Aggregators: These platforms compile data from various sources, offering quick overviews and often powerful search functionalities.
When consulting these sources, pay attention to the time the data was last updated and whether it refers to official closing prices or after-hours trading.
Beyond the Headline Number: Analyzing Volume and Volatility
While the closing price grabs headlines, it’s imperative for serious investors to look beyond this single figure. Two critical accompanying metrics are trading volume and volatility:
- Volume: This refers to the total number of shares or contracts traded for a security or index during the day. High volume accompanying a significant price move (up or down) suggests conviction behind that move, making it more robust. Low volume on a large price swing might indicate less conviction or manipulation. Analyzing volume against the closing price provides crucial context to the day’s events.
- Volatility: This measures the degree of variation of a trading price series over time. High volatility indicates large price swings throughout the day, suggesting uncertainty or heightened market activity. A closing price achieved after a highly volatile day might be less reliable as an indicator of a new trend compared to a close after a steady, low-volatility day. Indices like the CBOE Volatility Index (VIX), often called the “fear gauge,” track implied volatility and can offer insights into market expectations for future price movements.
By combining the closing price with volume and volatility, investors gain a much richer understanding of the market’s dynamics and the significance of the day’s performance.
After-Hours Trading vs. Official Close
It’s important to distinguish between the official market close and after-hours trading. While major exchanges typically close at 4:00 PM ET, electronic communication networks (ECNs) allow trading to continue for several hours afterward, and pre-market trading also occurs before the official open. Prices in after-hours trading can differ significantly from the official closing price due to lower liquidity, news events released post-market, or corporate announcements. The official close is the benchmark for daily performance and many financial calculations, but after-hours movements can offer clues about how the market might react at the next opening, making both relevant for a comprehensive view of a stock’s trajectory.
What Does Today’s Close Mean for Tomorrow?
The daily closing price of the stock market, while a critical summary of past performance, also serves as a foundational data point for anticipating future movements. For money managers and individual investors alike, the primary goal isn’t just to understand what happened, but to leverage that understanding to inform future strategies. This requires a nuanced perspective, balancing the immediate impact of daily figures with broader market trends and long-term financial objectives.
Short-Term vs. Long-Term Perspective
For active traders and those involved in day-to-day market movements, the daily close is a crucial piece of real-time information. It dictates entry and exit points, confirms or denies short-term hypotheses, and sets the tone for the next trading session. A strong close might signal momentum, while a weak one could prompt profit-taking or short positions.
However, for long-term investors focused on building wealth over years or decades, the daily close often represents market noise. While they monitor overall trends, they understand that a single day’s performance rarely alters their fundamental investment thesis or long-term financial plan. Strategies like dollar-cost averaging, where one invests a fixed amount regularly regardless of market fluctuations, exemplify this long-term view, mitigating the impact of daily volatility. For these investors, focusing too heavily on daily closes can lead to emotional decisions that undermine a well-thought-out strategy.
Identifying Trends and Patterns
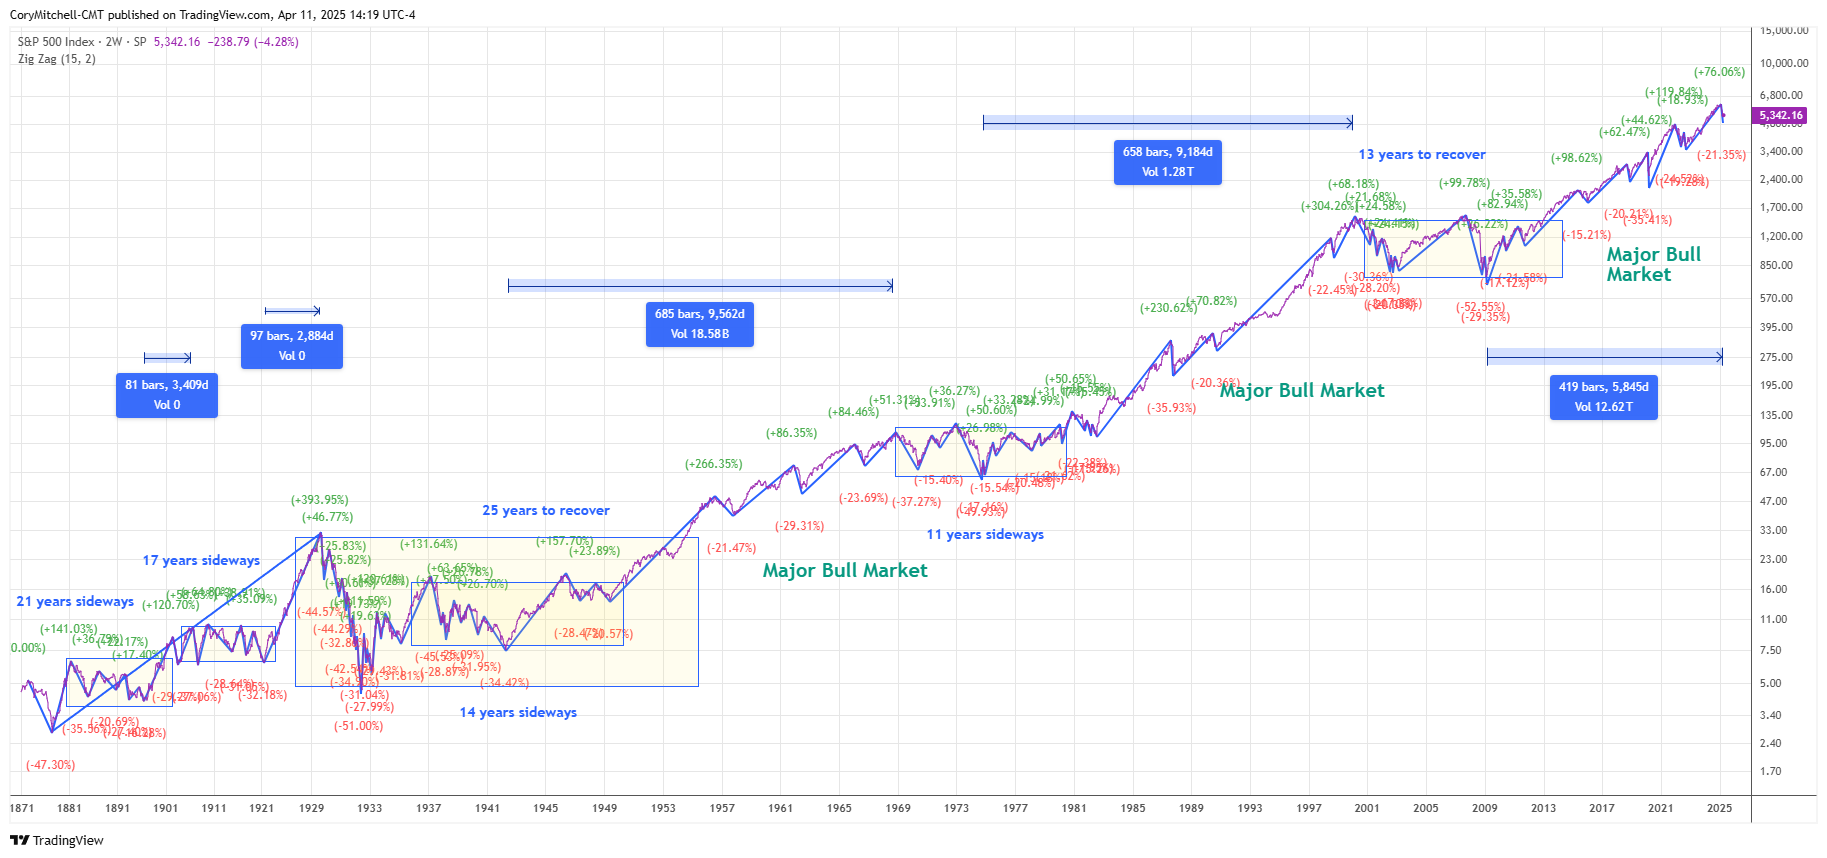
Despite the “noise” for long-term investors, consistently observing daily closes can help identify more significant trends and patterns. A series of higher closes might indicate a sustained uptrend (bull market), while consecutive lower closes could signal a downtrend (bear market). Analysts use daily closing prices to chart technical indicators such as moving averages, support and resistance levels, and candlestick patterns. For example, if an index consistently closes above its 200-day moving average, it might indicate a strong underlying trend. Conversely, a consistent failure to close above a key resistance level could signal a ceiling for prices. These patterns, built from daily closing data, help investors and analysts forecast potential shifts in market direction, even if those forecasts are not guaranteed.
Strategic Implications for Investors
Understanding the closing price has several strategic implications for investors:
- Avoid Impulsive Decisions: A strong rally or sharp decline at close can trigger emotional responses. A professional approach involves analyzing the why behind the move rather than reacting purely to the numbers.
- Portfolio Rebalancing: For those with diversified portfolios, significant daily moves can shift asset allocations. Monitoring closing prices helps determine when rebalancing is necessary to maintain the desired risk profile.
- Risk Management: Large swings in closing prices can signal increased market risk. This might prompt investors to review their stop-loss orders or consider hedging strategies to protect against potential downturns.
- Informing Future Research: A notable close, especially one driven by specific news or economic data, can serve as a catalyst for deeper research into affected companies or sectors. What happened today might shed light on where to look for opportunities or risks tomorrow.
Ultimately, while “what did the stock market close at” provides an immediate answer, the true value lies in using that answer as a stepping stone for informed analysis, strategic planning, and disciplined decision-making within the broader context of personal and business finance.
The Evolving Landscape of Market Data and Trading
The foundational act of monitoring “what did the stock market close at” remains constant, but the methods of arriving at those closes and the speed at which data is disseminated have undergone a profound transformation. The intersection of finance and technology has reshaped trading, data analysis, and investor access, creating an increasingly complex yet interconnected global market. For anyone engaged in the money niche, understanding these technological shifts is as crucial as understanding economic fundamentals.
Algorithmic Trading and High-Frequency Data
One of the most significant changes has been the rise of algorithmic trading and high-frequency trading (HFT). Instead of human traders shouting orders on an exchange floor, powerful computer algorithms now execute millions of trades per second, reacting instantaneously to market data, news, and even small price discrepancies. These algorithms analyze vast amounts of data, including current bid/ask prices, historical trends, and real-time news feeds, to make automated trading decisions. This means that daily closing prices are increasingly determined by the rapid-fire interaction of these sophisticated systems, leading to narrower spreads and greater market efficiency, but also potentially contributing to “flash crashes” or rapid market movements that can occur in milliseconds, beyond human comprehension speeds. The sheer volume and velocity of trades make the closing price a highly precise, mathematically derived figure, rather than the result of a few final human bids.
Global Interconnectedness and 24/7 News Cycle
The days of isolated national markets are long gone. Today’s financial landscape is characterized by profound global interconnectedness. The closing price of the U.S. market is significantly influenced by what happened earlier in the day in Asian and European markets, and vice-versa. A major economic announcement from China or a policy change in the European Central Bank can send ripples across the Atlantic, affecting how Wall Street opens and, ultimately, how it closes. This constant flow of information, driven by a 24/7 news cycle and instant global communication, means that there’s no true “off-switch” for market influencing events. Investors must now contend with factors emerging from every corner of the world at any hour, making the daily close a function of a continuous, global economic narrative.

The Rise of Retail Investors and Democratized Access
Perhaps the most democratizing aspect of modern market evolution has been the rise of retail investors empowered by technology. Online brokerage platforms, commission-free trading, and user-friendly investment apps have made stock market participation more accessible than ever before. A new generation of investors can easily access real-time market data, analytical tools, and financial news directly from their smartphones. While this democratization has its benefits, offering individuals unprecedented control over their finances, it also brings challenges. The proliferation of easily accessible data means navigating a sea of information, some reliable, some speculative. Understanding “what did the stock market close at” and its implications now requires filtering through a vast digital landscape, distinguishing credible analysis from social media hype, and maintaining a disciplined approach to investing amidst the constant buzz of information. This new era demands greater financial literacy and critical thinking from every individual participating in the money market.
aViewFromTheCave is a participant in the Amazon Services LLC Associates Program, an affiliate advertising program designed to provide a means for sites to earn advertising fees by advertising and linking to Amazon.com. Amazon, the Amazon logo, AmazonSupply, and the AmazonSupply logo are trademarks of Amazon.com, Inc. or its affiliates. As an Amazon Associate we earn affiliate commissions from qualifying purchases.