
In the increasingly data-driven world of technology, the ability to interpret and translate visual data into actionable mathematical models is an indispensable skill. A graph, in its essence, is a visual representation of relationships between variables. To truly harness the insights contained within, tech professionals, developers, data scientists, and engineers often need to distill these visual patterns into their underlying algebraic expressions – an equation. This transformation from a graphical display to a symbolic formula is not merely an academic exercise; it is a fundamental step in developing predictive algorithms, optimizing systems, designing user interfaces, and building robust software applications.
Understanding how to derive an equation from a graph empowers you to move beyond simple observation to quantitative analysis, enabling you to forecast trends, simulate scenarios, and codify relationships that drive technological innovation. This article explores various methods, from foundational analytical techniques to advanced software and AI-powered solutions, all framed within the context of their practical application in the tech landscape.
The Foundation: Understanding Graph Types and Their Equations
Before diving into methods of derivation, it’s crucial to recognize the common types of relationships graphs represent. Each fundamental shape corresponds to a specific family of equations, providing an initial framework for your analysis. Identifying the general form of the relationship significantly streamlines the process of finding its exact equation.
Linear Relationships: The Straight Line (y = mx + b)
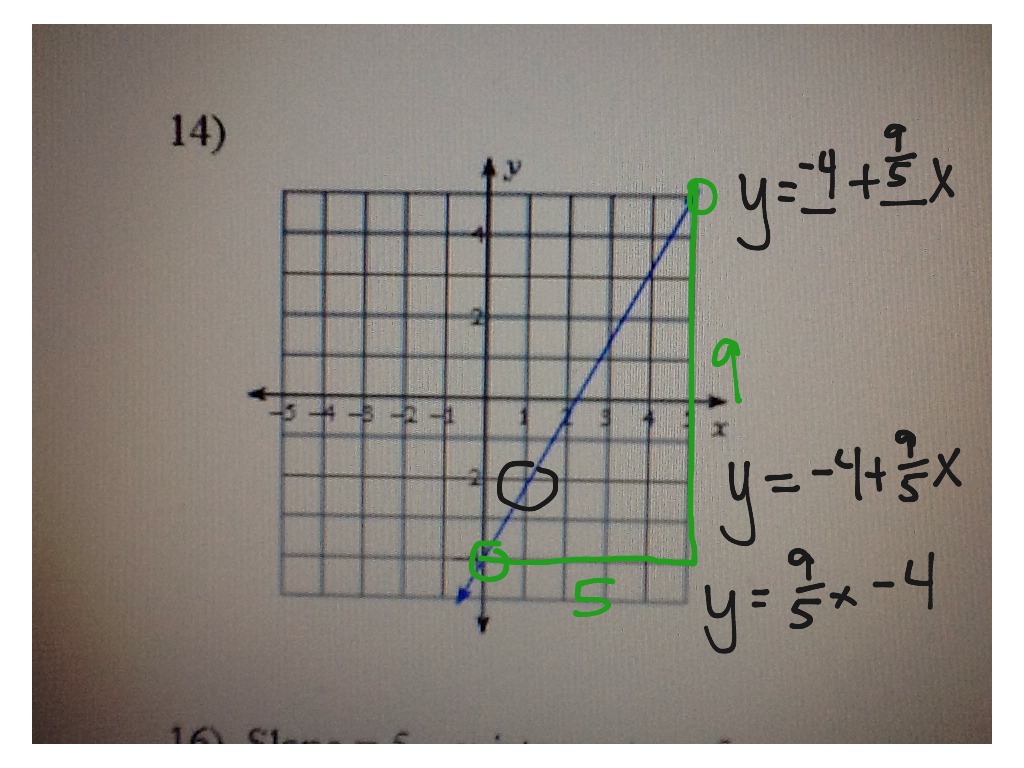
A straight line graph indicates a constant rate of change between two variables. In tech, this could represent anything from the linear scaling of computing resources with demand, to the steady improvement in algorithm efficiency over time, or the direct cost increase of hardware components. The equation y = mx + b is paramount here, where ‘m’ is the slope (rate of change) and ‘b’ is the y-intercept (the starting value or baseline). Recognizing a linear pattern is often the first step in simple predictive modeling or trend analysis.
Quadratic Relationships: The Parabola (y = ax^2 + bx + c)
Parabolic graphs, characterized by their U-shape (opening upwards or downwards), represent relationships where one variable changes at a non-constant rate relative to the square of another. In technology, quadratic functions might describe the trajectory of a projectile in game physics, the performance curve of certain algorithms under increasing load (e.g., O(n^2) complexity), or the power consumption characteristics of an electronic component. Identifying the vertex and points of symmetry are key to uncovering this type of equation.
Exponential Relationships: Growth and Decay (y = ab^x)
Exponential graphs depict rapid growth or decay. These are ubiquitous in tech, modeling phenomena such as Moore’s Law (exponential growth in transistor count), the spread of a virus or information through a network, radioactive decay in simulations, or the depreciation of assets. The equation y = ab^x (or y = ae^(kx)) highlights a consistent multiplicative factor of change. Recognizing this pattern is critical for modeling viral growth, compound interest in financial tech, or the performance limits of a system.
Other Common Types: Logarithmic and Power Relationships
Beyond these primary forms, tech professionals frequently encounter logarithmic relationships (inverse of exponential, often seen in phenomena like human perception of stimuli, or time complexity of efficient search algorithms like binary search) and power relationships (where one variable is proportional to a power of another, such as in scaling laws for deep learning models or fluid dynamics simulations). While more complex, their characteristic curves are distinct and, once identified, point towards specific equation families.
Manual Approaches: The Analytical Toolkit
Even with advanced software, understanding the manual methods for deriving equations is invaluable. It builds intuition, helps validate automated results, and provides a fallback when specialized tools aren’t readily available. This analytical toolkit involves carefully observing the graph’s features and performing basic calculations.
Identifying Key Points and Slopes
For a linear graph, the process is straightforward:
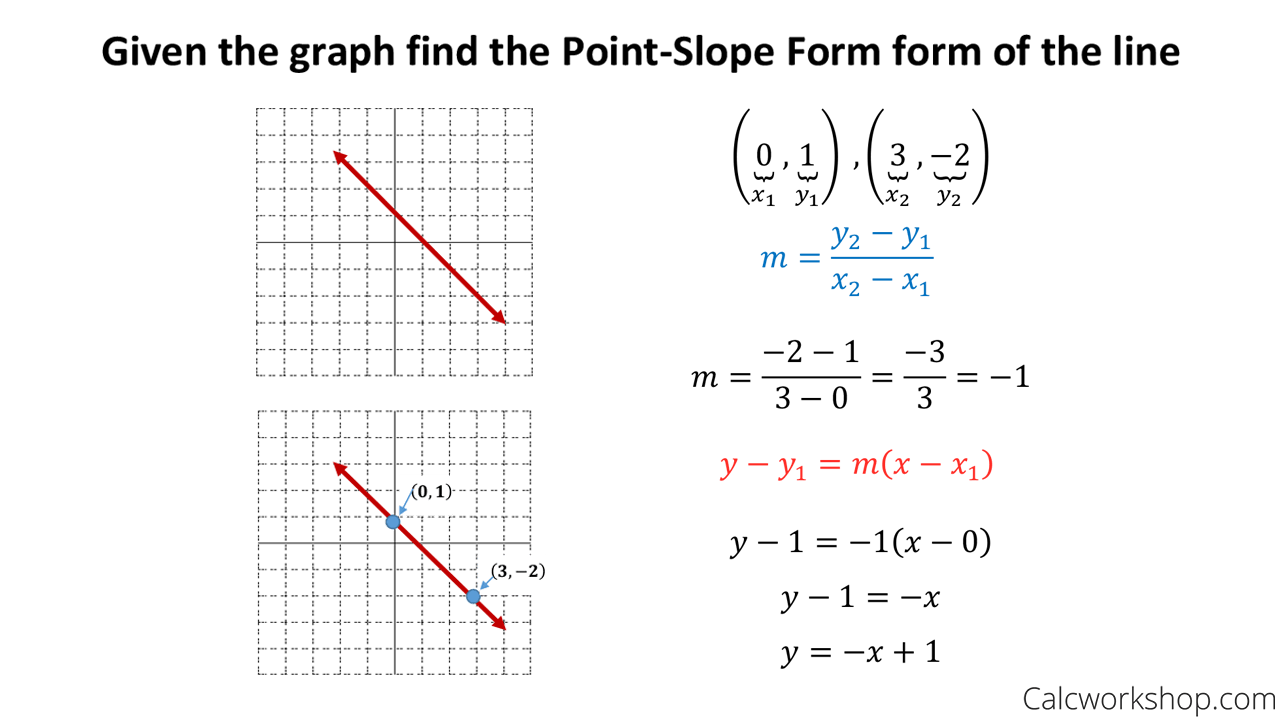
- Select Two Distinct Points: Choose two points on the line,
(x1, y1)and(x2, y2), that are easy to read accurately. - Calculate the Slope (m): Use the formula
m = (y2 - y1) / (x2 - x1). This ‘m’ represents the rate of change. - Find the Y-intercept (b): Once you have ‘m’, pick one of the points
(x1, y1)and substitute it into the linear equationy = mx + b:y1 = m * x1 + b. Solve for ‘b’. Alternatively, directly read the y-intercept if the line clearly crosses the y-axis at an integer value.
For non-linear graphs, this approach becomes more about identifying characteristic points:
- Quadratic: Look for the vertex
(h, k)and use the vertex formy = a(x - h)^2 + k. Find ‘a’ by substituting another point from the parabola. - Exponential: Identify the initial value (when x=0, which is ‘a’ in
y = ab^x) and then use another point to solve for ‘b’. - Logarithmic: Look for asymptotes and key points where the function crosses axes or specific values.
Using Intercepts and Vertexes
Intercepts (where the graph crosses the x or y-axis) and vertexes (for parabolas) provide critical anchor points. The y-intercept gives you ‘b’ directly in y = mx + b. The x-intercepts (or roots) can be crucial for factoring polynomial equations. For a parabola, the vertex provides (h, k), simplifying the equation to y = a(x-h)^2 + k, leaving only ‘a’ to be determined. Manually extracting these features is a foundational step before applying computational methods.
Challenges and Limitations
Manual methods, while insightful, are prone to inaccuracies, especially with complex curves, noisy data, or graphs lacking clear integer points. Reading values off a visual graph can introduce significant human error. They also become impractical for large datasets or for discerning subtle patterns that aren’t immediately obvious to the eye. This is where computational tools become essential.
Leveraging Software for Precision and Efficiency
The tech industry thrives on automation and precision, making software tools indispensable for deriving equations from graphs and data points. These tools not only reduce manual effort but also perform complex statistical analyses that are impossible to do by hand.
Spreadsheet Software (Excel, Google Sheets) for Trendlines and Regression
Spreadsheets are perhaps the most accessible and widely used tools for this task.
- Data Input: Enter your data points (x, y) into two columns. If you only have a graph, you’ll need to manually extract a sufficient number of points to represent the curve accurately.
- Chart Creation: Generate a scatter plot from your data.
- Add Trendline: Right-click on the data points in the chart and select “Add Trendline.”
- Choose Regression Type: Select the appropriate trendline type (Linear, Exponential, Logarithmic, Polynomial, Power) based on your visual assessment of the graph.
- Display Equation: Crucially, check the option “Display Equation on Chart.” The spreadsheet software will then calculate and present the best-fit equation for your chosen model directly on the graph. It often also provides an R-squared value, indicating how well the equation fits the data.
This functionality is invaluable for quick data exploration, preliminary model building, and visualizing relationships in performance metrics, financial forecasts, or resource allocation.
Scientific/Graphing Calculators
High-end graphing calculators (e.g., TI-84, Casio fx-CG50) offer similar regression capabilities in a portable format. You can input data points, view them on a scatter plot, and then run various regression analyses (linear, quadratic, exponential, power, etc.) to obtain the corresponding equations. These are particularly useful in educational settings or for quick calculations in the field where a full computer setup isn’t practical.
Programming Languages (Python with Libraries)
For robust, scalable, and custom analysis, programming languages like Python are the industry standard.
- NumPy and SciPy: These libraries provide powerful numerical computation and scientific tools, including functions for curve fitting (e.g.,
scipy.optimize.curve_fit). You define your function type (e.g., a linear functionf(x, m, b) = m*x + b) and then feed it your data, and the function will return the optimal parameters (m, b, a, etc.). - Matplotlib and Seaborn: These are visualization libraries. While not directly for deriving equations, they are essential for plotting your data and the fitted curve, allowing you to visually assess the quality of your derived equation.
- Pandas: For data manipulation and loading, especially when dealing with large datasets from various sources (APIs, databases, CSV files), Pandas is critical before applying fitting algorithms.
Using Python offers unparalleled flexibility, allowing engineers and data scientists to build complex models, handle large datasets, and integrate equation derivation into larger software systems or machine learning pipelines.
The Role of AI and Advanced Tools in Automated Equation Derivation
The frontier of equation derivation lies in the capabilities of Artificial Intelligence and advanced machine learning techniques. These tools go beyond simple regression, capable of identifying complex, non-obvious patterns and generating highly sophisticated models without explicit human guidance on the function type.
Machine Learning for Curve Fitting and Model Generation
Machine learning algorithms, particularly those used in regression tasks, are essentially designed to find the underlying equation (model) that best describes a given set of data points.
- Linear Regression: While basic, it’s a foundational ML algorithm for linear equations.
- Polynomial Regression: An extension of linear regression that fits a polynomial equation to the data, capable of modeling more complex curves.
- Decision Trees and Random Forests for Regression: These algorithms can learn non-linear relationships and segment data to create piecewise models that effectively act as complex equations.
- Neural Networks: Deep learning models, especially those designed for regression, can approximate virtually any continuous function. They learn intricate patterns from data to produce an output that can be thought of as a highly complex, multi-layered “equation,” even if not expressible in a simple algebraic form. They are particularly useful for high-dimensional data or when the underlying relationship is unknown or highly non-linear.
These ML approaches are crucial in areas like predictive analytics, anomaly detection, and natural language processing, where the relationships are often too complex for simple algebraic expressions.
Specialized Data Analysis Platforms
Beyond general programming languages, platforms like MATLAB, R, Wolfram Mathematica, and specialized data analysis software (e.g., SPSS, SAS, Tableau) offer dedicated tools for curve fitting, statistical modeling, and symbolic computation. These environments provide user-friendly interfaces for complex analyses, often with robust visualization and reporting features tailored for scientific and engineering applications. They allow for rapid iteration, testing different models, and performing advanced statistical validation of derived equations.
Interpreting AI-Generated Models
While AI can derive highly accurate models, a significant challenge in tech is interpreting these “black box” equations. For simple regression, the coefficients are directly interpretable. For complex neural networks, extracting a human-readable algebraic equation is often impossible. The focus shifts from the explicit equation to understanding the model’s predictions, its confidence, and its sensitivity to input changes. Techniques like SHAP (SHapley Additive exPlanations) values or LIME (Local Interpretable Model-agnostic Explanations) are used to gain insights into how complex AI models make their decisions, providing a form of “interpretation” even without a simple algebraic equation.
Best Practices and Applications in Tech
Successfully deriving and utilizing equations from graphs in a tech context requires more than just knowing the methods; it demands adherence to best practices and an understanding of real-world applications.
Data Preprocessing and Cleaning
Before attempting to derive any equation, clean your data. Noise, outliers, and missing values can significantly distort your derived equation. Techniques like smoothing, filtering, and outlier detection are essential in ensuring that the graph accurately represents the underlying phenomenon, leading to a more robust and reliable equation. This is a critical step in any data pipeline within tech.
Validating Your Equation
An equation is only as good as its fit to the actual data.
- Visual Inspection: Always plot your derived equation back onto the original graph (or scatter plot) to visually inspect how well it matches the data points.
- Statistical Metrics: Use metrics like R-squared (coefficient of determination) to quantify the goodness of fit. For regression models, consider mean squared error (MSE), root mean squared error (RMSE), or mean absolute error (MAE).
- Cross-Validation: For predictive models, split your data into training and testing sets. Derive the equation using the training data and then test its accuracy on unseen data (the testing set) to ensure it generalizes well and isn’t just overfitting to the training data.

Real-World Tech Applications
The ability to translate graphs into equations underpins countless tech applications:
- Predictive Analytics: Forecasting server load, user engagement, or system failures by modeling historical data.
- Software Performance Optimization: Developing equations that describe an algorithm’s runtime complexity or memory usage as a function of input size.
- Game Development: Creating realistic physics engines, animation curves, or resource management simulations.
- UI/UX Design: Modeling user behavior patterns or defining animation timings and easing functions.
- Financial Technology (FinTech): Building models for stock prediction, risk assessment, or algorithmic trading based on historical market data.
- IoT and Sensor Data Analysis: Deriving equations to model sensor readings for anomaly detection or predictive maintenance.
In conclusion, getting an equation from a graph is a foundational skill that bridges the gap between visual data and mathematical insight, a necessity for anyone operating in the tech domain. Whether using manual techniques, spreadsheet functions, powerful programming libraries, or advanced AI, mastering this ability unlocks a deeper understanding of data and empowers the creation of more intelligent, efficient, and innovative technological solutions. The ongoing evolution of tools will continue to simplify this process, but the core analytical thinking remains a timeless asset for every tech professional.
aViewFromTheCave is a participant in the Amazon Services LLC Associates Program, an affiliate advertising program designed to provide a means for sites to earn advertising fees by advertising and linking to Amazon.com. Amazon, the Amazon logo, AmazonSupply, and the AmazonSupply logo are trademarks of Amazon.com, Inc. or its affiliates. As an Amazon Associate we earn affiliate commissions from qualifying purchases.