In the dynamic world of finance, numbers tell a story. But raw figures alone often lack the context needed to truly understand performance, growth, or decline. This is where the concept of percentage difference—more commonly known and applied as percentage change in financial contexts—becomes an indispensable tool. Whether you’re a seasoned investor, a meticulous budgeter, a budding entrepreneur, or simply managing your personal finances, mastering how to determine and interpret percentage difference empowers you to make informed decisions, track progress, and uncover critical insights.
From evaluating the returns on your investments to dissecting monthly budget variances, or even assessing a company’s year-over-year revenue growth, understanding relative shifts provides a clearer, more actionable perspective than absolute numbers ever could. This guide will demystify percentage difference, explain its various interpretations, and illustrate its profound relevance across the spectrum of financial applications.

The Fundamentals: Grasping Relative Change in Finance
At its core, determining percentage difference is about understanding how much a value has changed relative to another. This isn’t just about simple arithmetic; it’s about providing scale and context. A change of $1,000 can be insignificant for a multi-million dollar corporation but catastrophic for an individual’s personal savings. Percentage calculations normalize these changes, allowing for meaningful comparisons across different scales.
Understanding Percentage Change: The Financial Standard
When most people in finance refer to “percentage difference” in the context of growth, decline, or performance, they are typically referring to percentage change. This calculation measures the relative change between an initial value and a final value, expressed as a percentage of the initial value. It’s the workhorse of financial analysis.
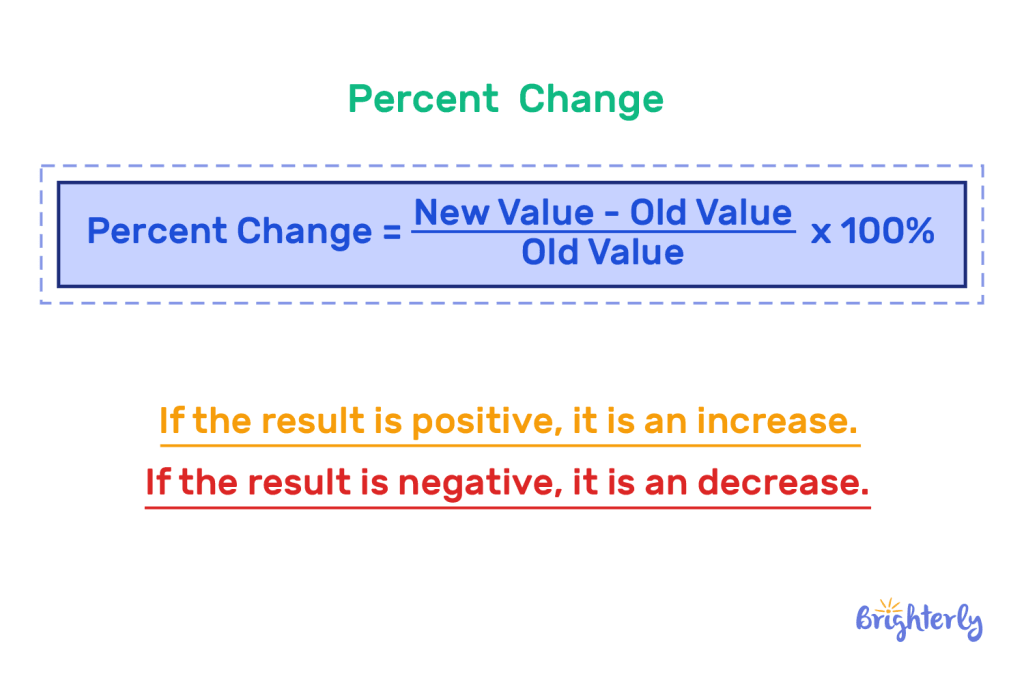
The formula for percentage change is:
$$ text{Percentage Change} = frac{text{(New Value – Old Value)}}{text{Old Value}} times 100% $$
Let’s break it down:
- New Value: The value after the change has occurred (e.g., current stock price, current month’s revenue).
- Old Value: The starting or baseline value (e.g., previous stock price, last year’s revenue).
Example: If your investment portfolio grew from $10,000 (Old Value) to $12,000 (New Value):
$$ text{Percentage Change} = frac{($12,000 – $10,000)}{$10,000} times 100% = frac{$2,000}{$10,000} times 100% = 0.20 times 100% = 20% $$
This means your portfolio experienced a 20% gain.
If your portfolio decreased from $12,000 to $10,000:
$$ text{Percentage Change} = frac{($10,000 – $12,000)}{$12,000} times 100% = frac{-$2,000}{$12,000} times 100% approx -0.1667 times 100% = -16.67% $$
This indicates a 16.67% loss.
Distinguishing Percentage Point Difference and Average-Based Percentage Difference
While “percentage change” is paramount, it’s important to be aware of other interpretations when the term “percentage difference” is used, especially to avoid confusion.
-
Percentage Point Difference: This simply measures the absolute difference between two percentages. It’s critical in finance when comparing interest rates, market share, or other metrics already expressed as percentages.
- Example: If an interest rate increases from 2% to 3%, the absolute change is 1 percentage point (3% – 2% = 1%). However, the percentage change in the interest rate itself is (3-2)/2 * 100% = 50%. Confusing these two can lead to significant misinterpretations, especially in loan calculations or investment returns.
-
Average-Based Percentage Difference: In some academic or statistical contexts, percentage difference is defined as the absolute difference between two values, divided by their average, then multiplied by 100%. This is typically used when there isn’t a clear “old” and “new” value, and you’re simply comparing two magnitudes.
- Formula: $$text{Percentage Difference (Average-Based)} = frac{text{|Value1 – Value2|}}{((text{Value1 + Value2}) / 2)} times 100%$$
- While mathematically valid, this specific formula is less commonly applied in everyday financial performance tracking than percentage change. For the rest of this article, we will focus on the more financially practical definition of percentage change when discussing “percentage difference,” as it provides direct insight into growth, decline, and relative performance against a baseline.
Practical Applications in Personal Finance
Understanding percentage change is not just theoretical; it’s a vital skill for managing your personal financial well-being. It transforms raw data into actionable insights, enabling better decision-making for your money.
Tracking Investment Performance
For any investor, monitoring performance is paramount. Percentage change is the backbone of this analysis:
- Stock Price Movements: Quickly gauge daily, weekly, or yearly fluctuations. A stock moving from $50 to $55 is a 10% gain, while a drop from $55 to $50 is a 9.09% loss – illustrating that percentage losses require greater percentage gains to recover.
- Portfolio Growth/Decline: Calculate your overall investment portfolio’s percentage return over various periods (e.g., year-to-date, 5-year average). This allows you to compare your performance against market benchmarks or other investment vehicles.
- Return on Investment (ROI): Whether it’s a real estate investment or a small business venture, ROI is a classic application of percentage change:
(Net Profit / Cost of Investment) x 100%.
Budgeting and Expense Analysis
Effective budgeting relies heavily on understanding trends and variances:
- Variance Analysis: Compare your actual spending against your budgeted amounts. If you budgeted $500 for groceries but spent $600, that’s a (600-500)/500 * 100% = 20% overspend. This quickly highlights areas needing adjustment.
- Tracking Spending Categories: Monitor how different expense categories change month-over-month or year-over-year. Did your utility bill increase by 15% from last winter? Why? This analysis helps you identify inflation impacts or consumption changes.
- Income Trends: Track your income growth (or decline) over time. Are you getting regular raises that keep pace with inflation?
Loan and Debt Management
Navigating debt effectively also benefits from percentage change analysis:
- Interest Rate Changes: For variable-rate mortgages or lines of credit, understand the percentage change in your interest rate. A 0.5 percentage point increase might translate to a significant percentage change in the rate itself, impacting your payments.
- Debt Reduction Progress: Calculate the percentage of your debt you’ve paid off over a specific period. Seeing a 10% reduction in your credit card balance can be a powerful motivator.
Smart Shopping and Savings
Even everyday financial decisions can be enhanced:
- Calculating Discounts: When a store advertises “30% off,” you’re using percentage change to determine your savings.
- Comparing Price Changes: Observe how prices of everyday goods change over time to understand personal inflation and adjust your spending habits.
Strategic Uses in Business Finance and Investing
For businesses and serious investors, percentage change moves from a helpful tool to an indispensable analytical framework for strategic planning, performance evaluation, and risk management.
Measuring Business Growth and Performance
Companies live and breathe by percentage change to assess their health and trajectory:
- Revenue Growth: Quarterly and annual percentage changes in revenue (e.g.,
YoY (Year-over-Year) Revenue Growth) are key indicators of market penetration and sales effectiveness. Investors keenly watch these figures. - Profit Margin Shifts: Tracking percentage changes in gross, operating, and net profit margins reveals efficiency improvements or cost control issues. A declining profit margin percentage, even with rising revenue, can signal problems.
- Market Share: Monitoring your market share’s percentage change relative to competitors or the total market helps assess competitive position.
- Key Performance Indicators (KPIs): From customer acquisition cost (CAC) percentage changes to employee productivity metrics, nearly all KPIs are evaluated using percentage shifts to determine success or areas for improvement.
Evaluating Investment Opportunities
Deep-diving into potential investments requires robust percentage analysis:
- Financial Statement Analysis: Examining percentage changes in a company’s assets, liabilities, and equity (from its balance sheet) or revenue, cost of goods sold, and net income (from its income statement) over several years reveals trends and financial health. This is often called
common-size analysis. - Earnings Per Share (EPS) Growth: A critical metric for stock investors is the percentage growth in EPS, indicating a company’s increasing profitability on a per-share basis.
- Dividend Growth Rates: For income-focused investors, the percentage increase in dividends paid out over time indicates a company’s commitment and capacity to return value to shareholders.
- Real Estate Appreciation: Calculating the percentage appreciation of property values allows investors to assess capital gains and compare different real estate opportunities.
Risk Assessment and Forecasting
Percentage change is integral to understanding financial risks and predicting future outcomes:
- Volatility: The percentage change in an asset’s price over short periods is a measure of its volatility, a key indicator of risk.
- Sensitivity Analysis: Businesses and investors use percentage change to model how a percentage shift in one variable (e.g., sales volume) might impact another (e.g., net profit). This helps in scenario planning.
- Forecasting: Projecting future revenue or expenses often starts with applying an expected percentage growth rate to current figures.
Common Pitfalls and Best Practices
While simple in concept, misapplying percentage change can lead to erroneous conclusions. Being aware of common pitfalls is crucial for accurate financial analysis.
Understanding the Base Value
The denominator in the percentage change formula – the “Old Value” – is critical.
- Choosing the Correct Baseline: Always ensure you’re comparing against the appropriate starting point. Comparing current month’s sales to last month’s is different from comparing it to the same month last year.
- The Zero Denominator Problem: You cannot calculate a percentage change if the “Old Value” is zero. If revenue goes from $0 to $100,000, it’s an absolute increase of $100,000, but a percentage change is undefined. In such cases, only the absolute change is meaningful.
Context is King
Numbers without context are just data points.
- Scale Matters: A 100% increase from $10 to $20 is numerically the same as a 100% increase from $1 million to $2 million. However, their financial implications are vastly different. Always consider the absolute values alongside the percentages.
- Apples to Apples: Ensure you are comparing comparable data. Don’t compare Q1 2023 sales to Q2 2022 sales unless you explicitly account for seasonality or other factors. Standardize your time periods and metrics.
- Beware of Small Bases: A company that grows 500% from $1,000 to $6,000 in revenue is less impressive than one that grows 5% from $1 billion to $1.05 billion, depending on the stage of the business. Rapid percentage growth is easier on a very small base.
Utilizing Financial Tools
While manual calculations are great for understanding, for robust analysis, leverage technology:
- Spreadsheets (Excel, Google Sheets): These are indispensable. Use formulas like
=(B2-A2)/A2to quickly calculate percentage changes across vast datasets. - Online Calculators: Numerous websites offer quick percentage change calculators for one-off calculations.
- Financial Software and Apps: Many budgeting, investing, and accounting platforms automatically calculate and display percentage changes for various metrics, streamlining your analysis.
Beyond the Basics: Advanced Financial Considerations
For those looking to deepen their financial understanding, percentage change forms the foundation for more complex concepts.
Compounding Effects
Percentage changes don’t just happen in isolation; they accumulate over time.
- Compound Annual Growth Rate (CAGR): This is a key metric in investing, representing the smoothed annualized percentage growth rate of an investment over a specified period longer than one year. It shows the growth as if it had grown at a steady rate, accounting for the effect of compounding.
- The Power of Small, Consistent Gains: Even small percentage gains, compounded over long periods, can lead to substantial wealth creation, as illustrated by the magic of compound interest.
Inflation and Real Returns
Nominal percentage changes can be misleading if you don’t account for purchasing power.
- Adjusting for Inflation: A 5% increase in your salary might feel good, but if inflation was 3%, your “real” percentage increase in purchasing power is only approximately 2%. Understanding this concept is crucial for assessing true wealth growth.
- Real Rate of Return: This calculates your investment return after subtracting the rate of inflation, providing a more accurate picture of your gains.
Percentage Point Differences vs. Percentage Changes Revisited
This distinction cannot be overstressed in advanced financial discussions.
- Example from a Macro Perspective: If the unemployment rate falls from 6% to 5%, it’s a 1 percentage point decrease. However, it’s a (5-6)/6 * 100% = -16.67% percentage change in the unemployment rate itself. Policymakers, economists, and journalists must be precise in their language to avoid misrepresenting economic shifts.

Conclusion
The ability to determine and interpret percentage difference, primarily percentage change, is more than a mathematical exercise; it’s a cornerstone of financial literacy. It equips individuals and businesses with the power to move beyond superficial numbers and gain profound insights into growth, decline, efficiency, and risk. From managing your daily budget and assessing investment returns to analyzing complex business financials, this fundamental skill demystifies data, clarifies performance, and empowers you to make smarter, more strategic financial decisions. Embrace percentage difference, and you unlock a clearer, more informed path to financial success.
aViewFromTheCave is a participant in the Amazon Services LLC Associates Program, an affiliate advertising program designed to provide a means for sites to earn advertising fees by advertising and linking to Amazon.com. Amazon, the Amazon logo, AmazonSupply, and the AmazonSupply logo are trademarks of Amazon.com, Inc. or its affiliates. As an Amazon Associate we earn affiliate commissions from qualifying purchases.