
The phrase “Dow Market” often conjures images of bustling trading floors, flashing tickers, and the ebb and flow of global financial tides. At its core, it refers to the Dow Jones Industrial Average (DJIA), one of the oldest, most frequently cited, and widely recognized stock market indices in the world. Far more than just a number, the Dow is a potent symbol of American economic health and a critical barometer for investors, economists, and the general public alike. Understanding the Dow market is not merely about knowing its daily fluctuations; it’s about grasping its historical significance, its mechanics, its strengths, and its limitations within the vast and complex ecosystem of global finance.
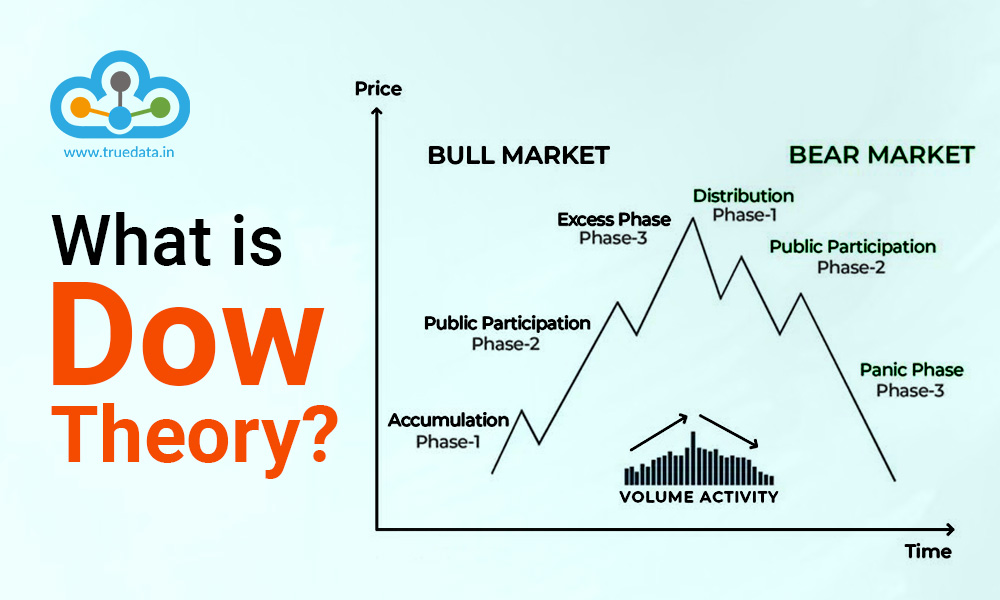
The Dow’s enduring presence in financial discourse is a testament to its powerful narrative. It encapsulates the journey of American capitalism, reflecting the rise and fall of industrial giants, technological revolutions, and the shifting landscape of economic power. For anyone looking to understand the pulse of the market, whether a seasoned investor, a budding entrepreneur, or simply a curious citizen, a deep dive into “what is the Dow market” is an indispensable step towards financial literacy and insightful decision-making.
Unpacking the Dow: A Historical Perspective
To truly appreciate the Dow, one must journey back to its origins, understanding the economic landscape that necessitated its creation and how it has adapted through over a century of profound change. Its longevity is a testament to its foundational relevance, even as the global economy has transformed beyond recognition from its initial industrial roots.
The Birth of an Industrial Barometer
The Dow Jones Industrial Average was conceived by Charles Dow, co-founder of Dow Jones & Company and former editor of The Wall Street Journal, in 1896. At its inception, it was designed to serve as a clear, concise measure of the health of the American industrial sector. The initial index comprised just 12 prominent industrial companies, including names like General Electric (the only original component still in the index until its removal in 2018), American Cotton Oil, and U.S. Leather. These were the titans of their era, representing the bedrock of the nascent American industrial economy: railroads, sugar, tobacco, and steel.
In a time before widespread electronic data and sophisticated financial models, Charles Dow sought a simple yet effective way to track the overall direction of the market. He believed that by averaging the stock prices of these leading companies, he could create a reliable indicator of broader economic trends. This innovation provided a much-needed lens through which investors and businesses could gauge market sentiment and economic momentum, offering a snapshot of industrial prosperity or decline that was accessible even to the layman. The Dow’s initial simplicity was its strength, providing a clear narrative at a time when financial data was scarce and often opaque.
From Rails to Tech: Evolution of Components
The composition of the DJIA has been far from static; it is a dynamic entity, constantly evolving to reflect the changing face of American industry and economy. Initially dominated by heavy manufacturing and transportation, the index has undergone numerous adjustments to ensure its continued relevance as a proxy for the broader market. Over the decades, companies that once defined industrial might have faded, replaced by new leaders in emerging sectors.
The most significant shifts have seen the gradual inclusion of consumer goods companies, financial services firms, healthcare giants, and, most notably in recent decades, technology powerhouses. The removal of traditional industrial names and the addition of companies like Apple, Microsoft, and Salesforce illustrate this profound transformation. This ongoing recalibration, managed by the editors of The Wall Street Journal, ensures that the Dow remains a pertinent reflection of the dominant economic forces shaping the nation. It’s a living document of economic history, where each change in its 30 components tells a story of innovation, industry disruption, and market leadership. This constant evolution is crucial for the Dow to maintain its status as a relevant indicator, preventing it from becoming an archaic relic.
How the Dow Jones Industrial Average (DJIA) Works
While often discussed in simplistic terms, the mechanics behind the DJIA are distinct from other major indices. Understanding its unique methodology is crucial for investors who rely on it as a benchmark and for financial commentators who dissect its daily movements. Its construction, particularly its price-weighted nature, sets it apart and influences how its movements are interpreted.
Understanding the Price-Weighted Average
Unlike market-capitalization-weighted indices such as the S&P 500, where larger companies (by total market value) have a greater impact on the index’s movement, the DJIA is a price-weighted average. This means that companies with higher stock prices have a proportionally greater influence on the index’s value than companies with lower stock prices, regardless of their total market capitalization.
For example, if a component stock trading at $300 moves by $1, its impact on the Dow will be significantly larger than a component stock trading at $50 moving by the same $1. This characteristic is both a defining feature and a source of frequent criticism, as it can potentially distort the perception of overall market performance by giving undue weight to a single, high-priced stock, even if that company represents a smaller fraction of the overall market value of the 30 companies. The logic behind this dates back to its origins when simplicity was paramount, but its implications in today’s complex markets are frequently debated.
The Role of the Divisor and Stock Splits
Given its price-weighted nature, the Dow’s calculation requires a special adjustment to maintain continuity and comparability over time. This adjustment comes in the form of the Dow Divisor. When the index was first created, it was a simple average of 12 stock prices, so the divisor was 12. However, corporate actions such as stock splits, mergers, spin-offs, or changes in the index’s components would cause an artificial jump or drop in the index’s value if a simple average were still used.
To counteract this, the Dow Divisor is continuously adjusted. When a component company undergoes a stock split, for instance, its share price drops, which would artificially lower the index. To prevent this, the divisor is reduced, ensuring that the index’s value remains unaffected by the split itself. Similarly, when a company is added or removed, the divisor is adjusted to maintain the index’s continuity. As of recent times, the Dow Divisor is significantly less than 1 (a fraction), meaning the index value is actually many times higher than the simple average of its components’ prices. This complex adjustment mechanism ensures that the Dow’s movement truly reflects changes in the market prices of its constituents, rather than being skewed by technical corporate actions.
Selecting and Managing the 30 Constituent Companies
The selection of the 30 companies that comprise the DJIA is not based on a rigid set of quantitative rules but rather on the subjective judgment of a committee. The editors of The Wall Street Journal, who oversee the index, strive to select large, well-established, and financially sound U.S. companies that have an excellent reputation, demonstrate sustained growth, and are of interest to a large number of investors. They also aim for a broad representation of the U.S. industrial and service economy, although it’s not strictly sector-balanced.
Changes to the Dow’s components are relatively infrequent, occurring only when a company’s business has significantly diminished its relevance to the broader economy, or when a change is deemed necessary to reflect major shifts in the U.S. economic landscape. For example, a company might be removed due to bankruptcy, a significant decline in market capitalization, or a strategic decision to make the index more representative of current economic trends. These adjustments are significant events in the financial world, often signaling a shift in economic power and drawing considerable media attention, reinforcing the Dow’s role as a bellwether.
Significance and Limitations of the Dow
Despite its age and unique calculation method, the Dow maintains a prominent position in financial markets and public consciousness. However, like any financial indicator, it comes with its own set of advantages and disadvantages that investors and analysts must consider. Understanding these aspects is key to interpreting its movements effectively.
A Bellwether for the U.S. Economy
For many, the Dow is synonymous with the overall health of the American economy. Its movements are often reported as a leading indicator of market sentiment and economic direction. A rising Dow is typically interpreted as a sign of economic expansion, corporate profitability, and investor optimism, while a falling Dow can signal recessionary fears, decreased corporate earnings, and declining investor confidence. Because its components are large, multinational corporations, their performance often reflects not only domestic economic conditions but also global trends, making the Dow a broad, albeit imperfect, proxy for global economic sentiment among large-cap companies.
Its daily performance is headline news, serving as a quick, accessible snapshot for individuals who may not follow the intricacies of other, more comprehensive indices. This accessibility makes it a powerful tool for public perception, influencing consumer and business confidence, which in turn can have real economic effects. When the Dow experiences significant drops, it often triggers widespread concern, whereas a record high can fuel a sense of prosperity and stability.

Benchmarking Investment Performance
Professional and individual investors frequently use the DJIA as a benchmark against which to measure the performance of their portfolios. If an investor’s portfolio of U.S. large-cap stocks outperforms the Dow over a given period, they might consider their investment strategy successful. Conversely, underperformance might prompt a reevaluation of their holdings or strategy. This benchmarking function is critical for performance assessment, enabling investors to gauge whether their active management is adding value relative to a passive investment in a broad market index.
However, its relatively narrow focus (just 30 companies) compared to other indices means it’s often more appropriate as a benchmark for portfolios heavily concentrated in blue-chip, large-cap companies. For portfolios with broader diversification across market capitalizations or sectors, other indices might serve as more fitting benchmarks. Nevertheless, its long history and consistent methodology provide a robust data set for long-term performance comparisons.
Criticisms: Narrow Focus and Price-Weighting Bias
Despite its widespread popularity, the DJIA is not without its critics. The most significant critiques often revolve around two key areas: its narrow focus and its price-weighting bias.
Firstly, with only 30 companies, the Dow is not truly representative of the vast diversity and breadth of the entire U.S. stock market. The U.S. market comprises thousands of publicly traded companies across numerous sectors, and relying on just 30 can lead to an incomplete picture. Small-cap, mid-cap, and many emerging industries are not directly represented in the Dow, which means that significant economic trends or market movements outside of its components might be overlooked when solely observing the DJIA. This narrowness means that a strong performance by a few highly weighted companies can mask weakness in the broader market, and vice versa.
Secondly, the price-weighted methodology is frequently criticized for giving disproportionate influence to companies with high stock prices, regardless of their actual market capitalization. A company with a high share price but a relatively small market value could move the index more than a massive company with a lower share price. This can create a distorted view of market leadership and overall market capitalization trends. For instance, a $1 move in a $400 stock has a much greater impact than a $1 move in a $100 stock, even if the $100 stock belongs to a much larger company by market cap. This inherent bias is often seen as less reflective of true market wealth compared to market-cap-weighted indices.
The Dow in the Broader Investment Landscape
Understanding the Dow market also requires placing it within the context of the broader universe of financial indices and investment strategies. It doesn’t operate in a vacuum but rather as one of several vital tools investors use to navigate the market.
Comparing the Dow to Other Major Indices (S&P 500, Nasdaq Composite)
While the Dow is historically significant, investors often look to other indices for a more comprehensive market view.
- S&P 500: The S&P 500 is often considered a superior benchmark for the overall U.S. stock market. It tracks 500 of the largest publicly traded companies in the United States and is market-capitalization-weighted, meaning companies with larger market values have a greater impact on the index. This broader scope and weighting methodology make it a more accurate representation of the total market wealth and performance.
- Nasdaq Composite: The Nasdaq Composite is heavily weighted towards technology and growth companies, listing over 3,000 stocks traded on the Nasdaq exchange. It’s also market-cap-weighted and provides a clearer picture of the performance of the tech sector and high-growth innovators, which are increasingly important drivers of the modern economy.
Each of these indices serves a distinct purpose, offering different lenses through which to view market segments. The Dow provides a focused look at blue-chip industrial and service leaders, the S&P 500 offers a broad representation of large-cap U.S. equities, and the Nasdaq Composite highlights the technology and growth-oriented sectors. Savvy investors often consider all three to form a holistic market perspective.
Investing in the Dow: ETFs and Index Funds
While one cannot directly “invest in the Dow” in the same way one buys shares of a company, investors can gain exposure to its performance through various financial instruments. The most common and accessible ways are through Exchange Traded Funds (ETFs) and index mutual funds that track the DJIA.
- ETFs: Funds like the SPDR Dow Jones Industrial Average ETF (DIA), often referred to as “Diamonds,” aim to replicate the price and yield performance of the DJIA. By purchasing shares of such an ETF, investors gain diversified exposure to the 30 companies in the index in a single transaction. These are typically low-cost, passively managed funds that trade like individual stocks on an exchange.
- Index Funds: Similar to ETFs, index mutual funds tracking the Dow provide a way to invest in its components. These are managed by fund companies and offer a diversified basket of stocks, mirroring the index. Both ETFs and index funds offer an efficient way for investors to participate in the performance of the Dow without having to buy individual shares of all 30 companies. This accessibility democratizes investment in a key market segment.
What Dow Movements Mean for Investors
The daily movements of the Dow can convey a great deal of information to investors. A strong upward trend, particularly over an extended period, suggests a bullish market, indicating investor confidence in the economy and corporate earnings. This might encourage investors to increase their exposure to equities or take on more risk. Conversely, sharp declines or a prolonged downward trend (a bear market) signal caution, potential economic contraction, or increased volatility. This might prompt investors to de-risk their portfolios, seek safer assets, or look for buying opportunities during downturns.
However, it’s crucial for investors to look beyond day-to-day fluctuations and consider the broader economic context. Short-term movements can be driven by temporary news cycles, speculation, or technical factors. Long-term investment decisions should be based on a thorough understanding of fundamental economic indicators, company valuations, and personal financial goals, rather than solely on the Dow’s daily performance. The Dow is a powerful signal, but it’s one piece of a much larger puzzle.
Beyond the DJIA: Other Dow Indices
While the DJIA is undoubtedly the most famous, the Dow Jones family of indices extends far beyond the industrial average, offering specialized views into other crucial sectors of the economy. These additional indices provide valuable insights for investors seeking more granular information or diversification.
Dow Jones Transportation Average (DJTA)
Created by Charles Dow even before the DJIA in 1884, the Dow Jones Transportation Average (DJTA) is often considered a leading indicator of economic activity. It tracks 20 major U.S. transportation companies, including airlines, railroads, and trucking firms. The logic behind its significance is that if goods aren’t being transported, they aren’t being produced or consumed, signaling a slowdown in the economy. Conversely, increased transportation activity points to economic growth. Its movements are frequently analyzed in conjunction with the DJIA as part of “Dow Theory,” a market analysis approach suggesting that major market trends are confirmed when both averages move in the same direction.
Dow Jones Utility Average (DJUA)
The Dow Jones Utility Average (DJUA) comprises 15 major U.S. utility companies, including electric, gas, and telecommunications firms. This index is generally considered more stable and less volatile than the DJIA or the DJTA. Utility companies typically offer consistent dividends and are often seen as defensive investments, performing relatively well during economic downturns due to the essential nature of their services. The DJUA provides insight into the performance of a crucial, often regulated, sector of the economy, offering a different perspective on market stability and investor sentiment towards income-generating assets.

The Dow Jones Global and Sector Indices
Beyond these historic averages, Dow Jones S&P Indices (a joint venture) manages a vast array of other indices that cover various global markets, sectors, and asset classes. These include:
- Dow Jones Global Titans 50: Tracks 50 of the largest and best-known multinational companies worldwide.
- Dow Jones Sustainability Indices: Focuses on companies leading in sustainability performance.
- Dow Jones U.S. Select Dividend Index: Tracks high-dividend-paying U.S. companies.
These specialized indices cater to specific investment strategies and analytical needs, allowing investors to benchmark performance against particular market segments or geographic regions. They demonstrate how the foundational concept behind Charles Dow’s initial vision has evolved into a sophisticated toolkit for modern financial analysis, providing comprehensive data points for a diverse global investment community.
In conclusion, the “Dow market,” primarily represented by the Dow Jones Industrial Average, is a cornerstone of financial discourse. Its century-plus history, unique price-weighted methodology, and evolving composition offer a fascinating window into the American economy. While it serves as a powerful symbol and a key bellwether, savvy investors recognize its limitations and integrate its insights with those from other comprehensive indices. By understanding the Dow’s mechanics, its historical context, and its place in the broader financial landscape, one can gain a deeper, more nuanced appreciation for the complex dynamics of the global capital markets and make more informed financial decisions.
aViewFromTheCave is a participant in the Amazon Services LLC Associates Program, an affiliate advertising program designed to provide a means for sites to earn advertising fees by advertising and linking to Amazon.com. Amazon, the Amazon logo, AmazonSupply, and the AmazonSupply logo are trademarks of Amazon.com, Inc. or its affiliates. As an Amazon Associate we earn affiliate commissions from qualifying purchases.