For modern investors, few tickers have commanded as much attention, capital, and speculation as NVDA. While the query “what is Nvidia stock price today” is often the starting point for a casual observer, the answer for a serious investor involves much more than a fluctuating numerical value on a screen. To understand Nvidia’s price today is to understand the intersection of exponential revenue growth, institutional sentiment, and the fundamental shift in global computing infrastructure.
In the current financial landscape, Nvidia has transitioned from a specialized semiconductor manufacturer into a cornerstone of the global equity markets. As one of the largest companies in the world by market capitalization, its daily price movements influence major indices like the S-and-P 500 and the Nasdaq-100. This article provides a comprehensive financial analysis of Nvidia’s valuation, the metrics that drive its price, and the strategic outlook for those looking to build or manage a position in this market leader.
The Financial Evolution of NVIDIA: Revenue Growth and Profitability
To assess Nvidia’s current stock price, one must first look at the trajectory that brought it to its multi-trillion-dollar valuation. The company’s financial narrative has shifted dramatically over the last five years, moving from a cyclical gaming-focused business to a high-margin data center powerhouse.
Historical Performance and Recent Milestones
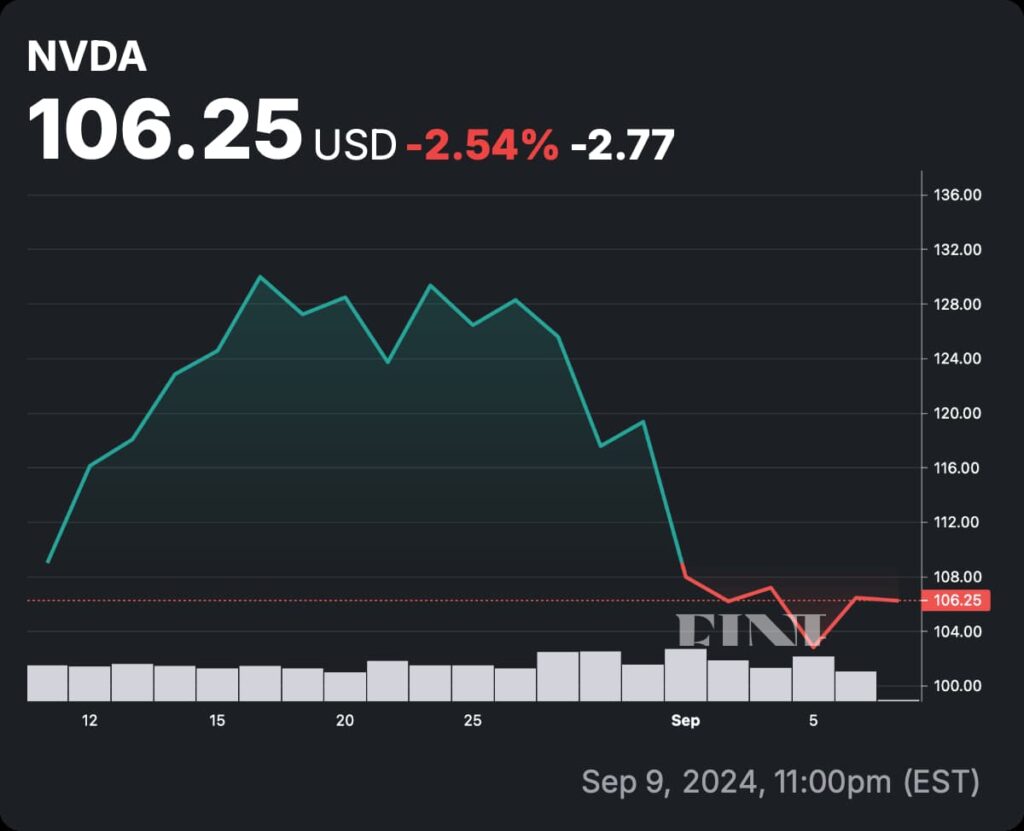
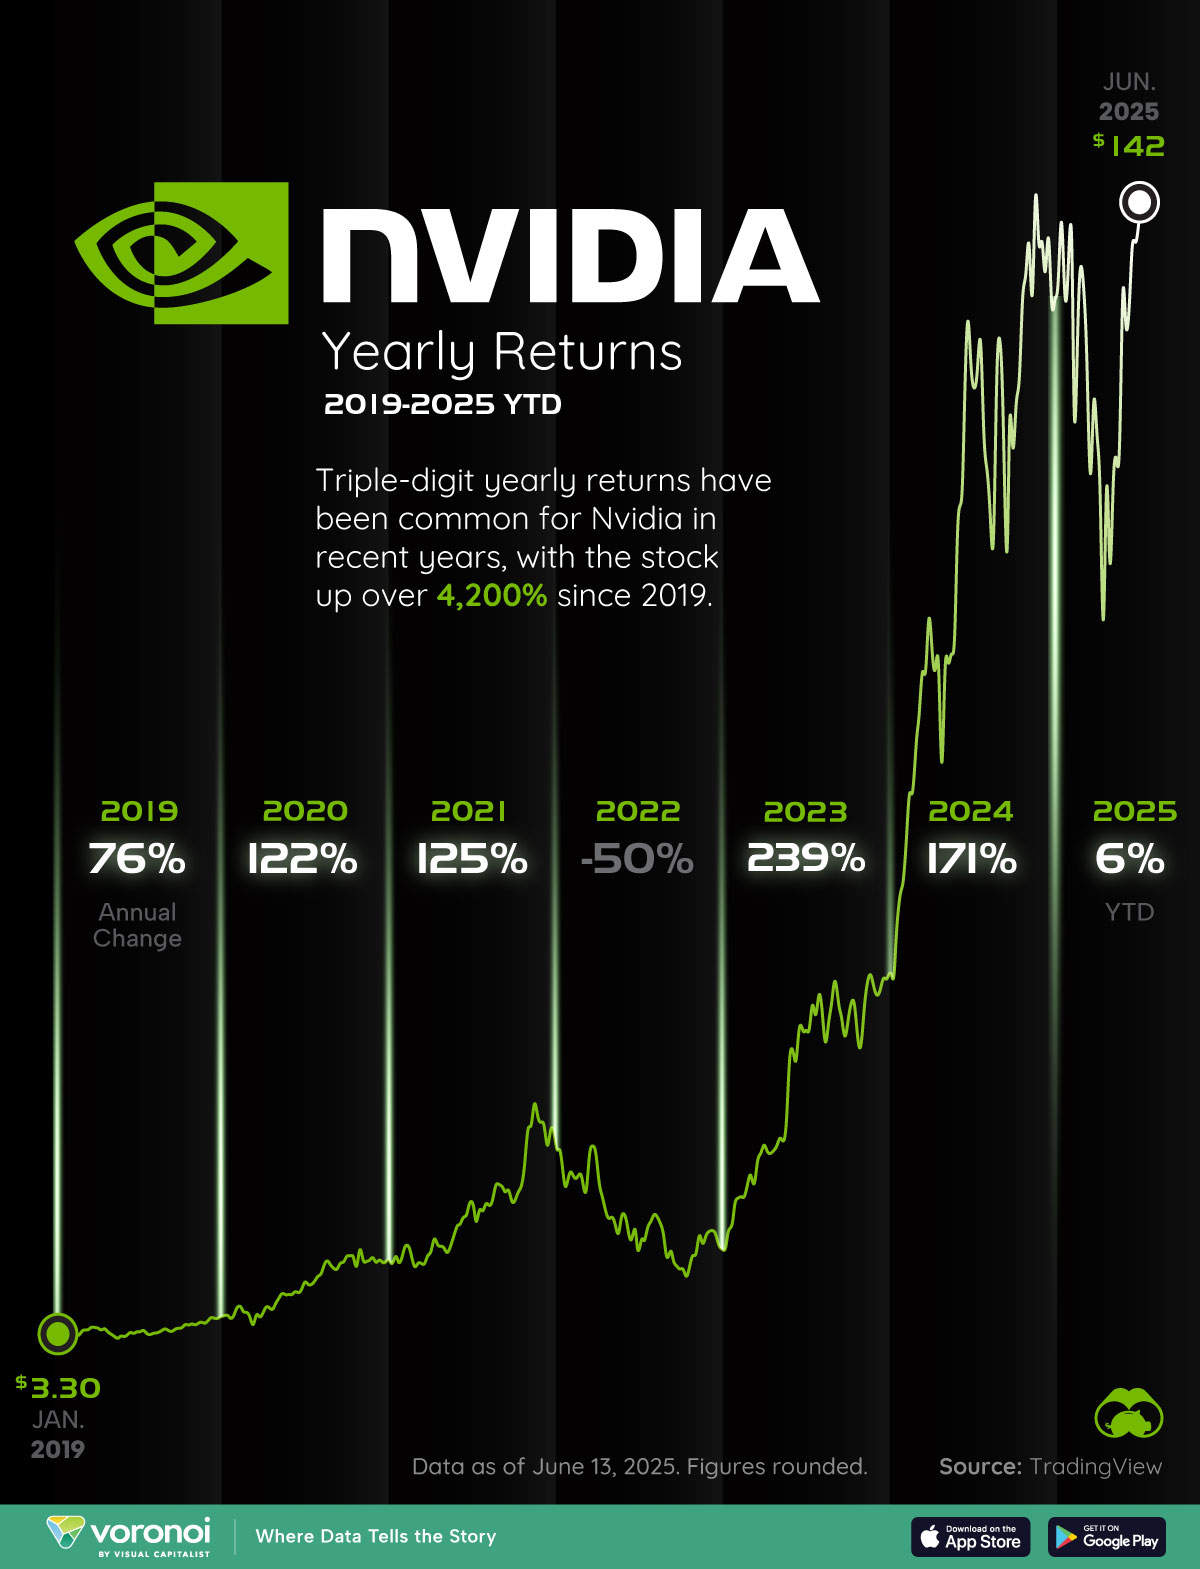
Historically, Nvidia’s stock price was tied to the release of new consumer graphics cards and the health of the PC gaming market. However, the “Great Re-rating” occurred when the company’s data center segment began to dwarf its gaming revenue. Investors saw a company capable of triple-digit year-over-year revenue growth—a feat rarely seen in companies of this scale. In recent fiscal years, Nvidia has consistently outperformed analyst expectations (the “beat and raise” phenomenon), which has acted as a primary catalyst for its price appreciation. This historical context is vital because it explains why the market is willing to pay a premium for the stock today compared to a decade ago.
Analyzing the Balance Sheet and Free Cash Flow
A stock’s price is ultimately a reflection of the present value of its future cash flows. Nvidia’s balance sheet is a testament to its operational efficiency. The company maintains a robust cash position with relatively low debt-to-equity ratios. More importantly, its free cash flow (FCF) generation has skyrocketed. Unlike many high-growth tech firms that burn cash to acquire market share, Nvidia has achieved massive scale while maintaining industry-leading gross margins—often exceeding 70%. For the value-conscious investor, these margins provide a “safety buffer,” suggesting that the company can remain profitable even if market conditions tighten or competition intensifies.
Key Valuation Metrics for Investors
When an investor asks about the price today, they are implicitly asking if that price is “fair.” Determining the fairness of Nvidia’s valuation requires a move beyond the share price and into specific financial ratios that compare the price to the company’s underlying earnings power.
Price-to-Earnings (P/E) and PEG Ratio Analysis
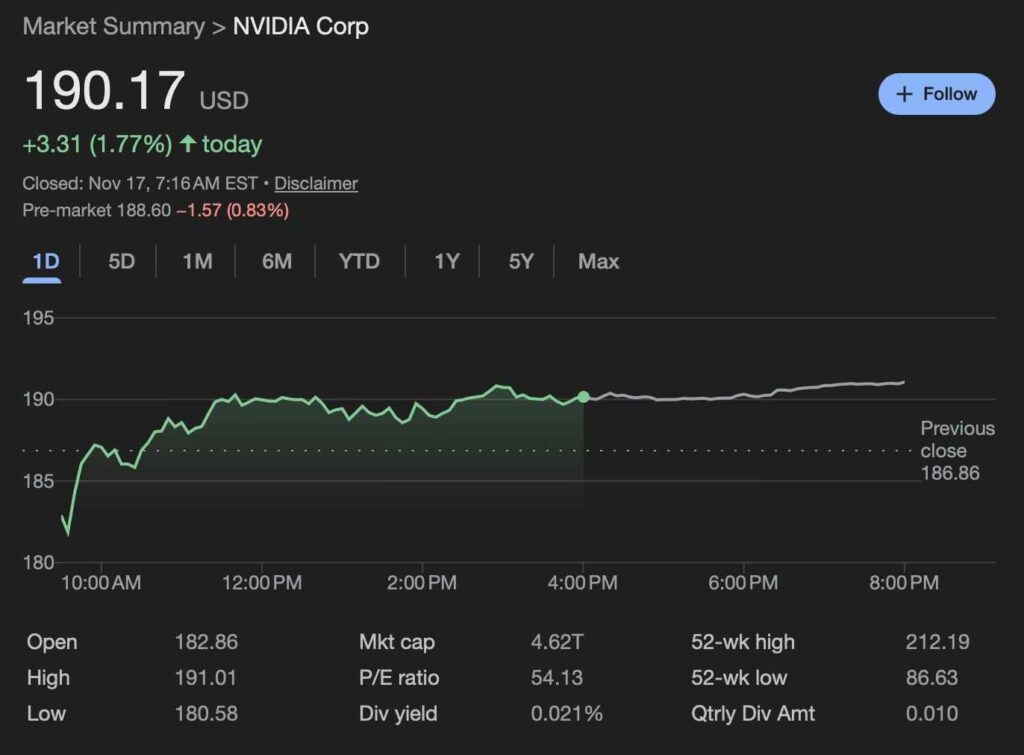
The Price-to-Earnings (P/E) ratio is the most common metric used to evaluate whether a stock is overvalued. Because Nvidia grows so rapidly, its “Trailing P/E” often looks expensive. However, sophisticated investors look at the “Forward P/E,” which accounts for projected earnings over the next twelve months.
Furthermore, the Price/Earnings-to-Growth (PEG) ratio is perhaps the most relevant tool for Nvidia. By dividing the P/E ratio by the company’s growth rate, the PEG ratio helps determine if the stock is expensive relative to its expansion. Throughout its recent rally, Nvidia’s PEG ratio has often remained surprisingly reasonable—sometimes even lower than slower-growing competitors—indicating that the earnings growth is largely keeping pace with the stock price increase.
Institutional Ownership and Capital Allocation
Nvidia is a “crowded trade,” meaning it is a staple in almost every major institutional portfolio, from pension funds to hedge funds. Institutional ownership accounts for a significant percentage of the float, which can lead to volatility during quarterly rebalancing periods.
Investors should also monitor the company’s capital allocation strategies, such as stock buybacks and dividend payments. While Nvidia’s dividend yield is traditionally low, its share repurchase programs indicate management’s confidence that the stock is undervalued or that they have excess capital that cannot be more efficiently deployed elsewhere. These buybacks reduce the total share count, effectively increasing the earnings per share (EPS) and supporting a higher stock price over time.
Macroeconomic and Sector Trends Affecting Stock Price
No stock exists in a vacuum. Nvidia’s price today is influenced by broader economic forces that dictate how much risk investors are willing to take and how much capital is flowing into the technology sector.
The Impact of Interest Rates on Tech Valuations
As a “growth stock,” Nvidia is sensitive to the Federal Reserve’s interest rate policy. High-growth companies are often valued based on cash flows expected far into the future. When interest rates rise, the “discount rate” applied to those future cash flows also rises, which can compress valuation multiples and pull the stock price down. Conversely, in a stabilizing or declining interest rate environment, investors are often willing to pay more for growth, providing a tailwind for Nvidia’s share price. Monitoring the yield on the 10-Year Treasury is often just as important for Nvidia investors as monitoring the company’s own earnings reports.
Supply Chain Dynamics and Capital Expenditures
Nvidia’s financial health is inextricably linked to its supply chain, particularly its relationship with fabrication giants like TSMC. Any disruption in global logistics or semiconductor manufacturing capacity can lead to a “supply-constrained” environment, where Nvidia cannot meet the demand for its products, potentially hurting its stock price.
Additionally, investors must watch the Capital Expenditure (CapEx) trends of Nvidia’s largest customers—companies like Microsoft, Alphabet, and Meta. If these “hyperscalers” reduce their spending on infrastructure, Nvidia’s revenue could plateau. The stock price today reflects the market’s belief that these companies will continue to spend billions on the hardware necessary to power the next generation of computing.
Strategic Investment Outlook: Is It a Buy, Sell, or Hold?
Deciding whether to enter or exit a position at today’s price requires an analysis of the long-term risk-reward profile. Investing in a high-momentum stock like Nvidia requires a disciplined approach to risk management.
Long-term Growth Drivers and the Economic “Moat”
The primary bull case for Nvidia rests on its “moat”—the structural advantages that prevent competitors from stealing market share. This moat is not just hardware; it is the software ecosystem (CUDA) that has become the industry standard. From a business finance perspective, this creates high switching costs for customers, ensuring recurring revenue and pricing power. As industries ranging from healthcare to automotive integrate advanced data processing, the addressable market for Nvidia continues to expand. If an investor believes we are in the early stages of a multi-decade shift in computing, today’s price may be viewed as an entry point for long-term compounding.
Risk Assessment: Market Volatility and Competition
No investment is without risk. For Nvidia, the primary financial risks include geopolitical tensions—specifically export restrictions to major markets like China—and the inevitable rise of competition from both traditional rivals and in-house chip development by major tech firms.
Furthermore, the stock is prone to significant “drawdowns.” It is not uncommon for high-flying tech stocks to experience 20% to 30% corrections even during a broader bull market. Investors must determine their own risk tolerance: can they withstand the volatility inherent in a high-beta stock? Using strategies like dollar-cost averaging (DCA) can help mitigate the risk of “timing the market” poorly and buying at a local peak.
Conclusion: The Price of Leadership
When you look at “what is Nvidia stock price today,” you are viewing the market’s real-time appraisal of a company that has become the engine of the modern economy. From a money and investing perspective, Nvidia represents a unique blend of massive scale and hyper-growth. While the valuation may seem daunting to some, it is backed by record-breaking profitability and a dominant market position.
For the disciplined investor, the share price is merely one data point. A true financial analysis considers the P/E ratios, the macro-environment, and the sustainability of the company’s margins. Whether you view Nvidia as a core holding or a tactical trade, its influence on the financial world is undeniable. In the world of investing, price is what you pay, but value—driven by earnings, innovation, and market leadership—is what you ultimately get. Stay informed, monitor the fundamentals, and remember that in the stock market, the most expensive price is often paid for a lack of patience.
aViewFromTheCave is a participant in the Amazon Services LLC Associates Program, an affiliate advertising program designed to provide a means for sites to earn advertising fees by advertising and linking to Amazon.com. Amazon, the Amazon logo, AmazonSupply, and the AmazonSupply logo are trademarks of Amazon.com, Inc. or its affiliates. As an Amazon Associate we earn affiliate commissions from qualifying purchases.