
When evaluating the transition to renewable energy, the primary question for any savvy investor or homeowner is: “How much electricity does a solar panel actually generate?” On the surface, this appears to be a technical question about physics and photons. However, in the realm of personal finance and wealth management, the answer represents the “yield” on a long-term capital asset. Understanding the output of a solar array is the first step in calculating your internal rate of return (IRR) and determining how quickly a system will pay for itself through utility bill avoidance and passive income generation.
To view solar through a financial lens, we must move beyond the simple presence of panels on a roof and into the metrics of kilowatt-hours (kWh), degradation rates, and the monetization of sunlight.
Understanding the Math: Calculating Energy Production and Its Monetary Value
The financial viability of a solar installation is predicated on its ability to replace an escalating monthly expense—your utility bill—with a fixed-cost infrastructure. To understand the “how much,” we first need to distinguish between capacity and production.
The Standard Output Metrics (Watts and kWh)
Solar panels are rated by their “nameplate capacity,” typically ranging from 350 to 450 watts for modern residential modules. This number represents the amount of power the panel produces under Standard Test Conditions (STC)—laboratory settings with ideal light and temperature. However, from an investment perspective, the “Watt” is less important than the “Kilowatt-hour” (kWh).
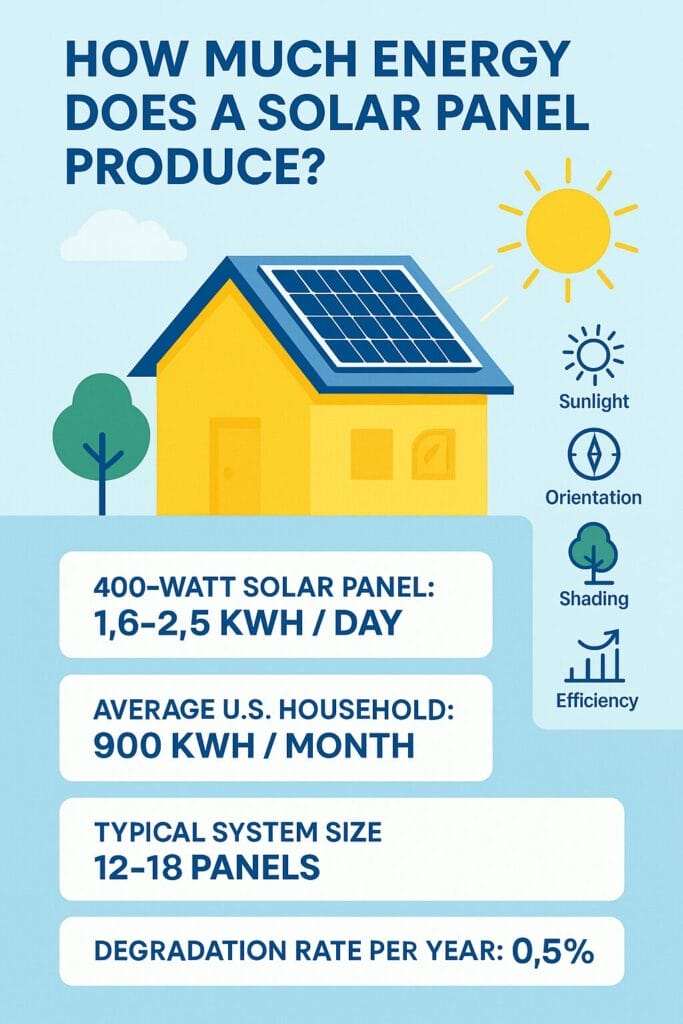
While Watts represent instantaneous power, kWh represent the energy used over time—which is what you are billed for. To estimate daily production, a common rule of thumb is to multiply the panel’s wattage by the number of “peak sun hours” your location receives. For example, a 400-watt panel in a region with 5 peak sun hours will generate roughly 2,000 watt-hours, or 2 kWh, per day. Over a year, that single panel produces roughly 730 kWh.
Converting Sunlight into Cash: The Utility Bill Offset
The “Money” aspect of solar production becomes clear when you apply local utility rates to these figures. If your utility company charges $0.20 per kWh, that single 400-watt panel is generating $146 worth of electricity annually. A standard 8 kW (8,000-watt) residential system, consisting of 20 such panels, would generate roughly 14,600 kWh per year, representing a gross annual savings of $2,920.
By treating the solar array as a financial instrument, you can see that the “dividend” it pays is the avoided cost of energy. Unlike traditional stocks, these “dividends” are untaxed, as they represent a reduction in personal expenses rather than earned income, making the effective yield even higher.
The Variables Affecting Your ROI: Efficiency, Location, and Orientation
Just as a real estate investment is dictated by “location, location, location,” the financial performance of a solar panel is dictated by its environment. If the generation drops, the ROI timeline lengthens. Understanding these variables is crucial for accurate financial forecasting.
Geographical Impact on Yield
A solar panel in Arizona will generate significantly more revenue than the exact same panel in Washington state. This is due to the “solar irradiance” of the region. Investors must use tools like the National Renewable Energy Laboratory’s (NREL) PVWatts calculator to estimate regional performance.
In high-irradiance zones, the “payback period”—the time it takes for the cumulative savings to equal the initial investment—can be as short as 5 to 7 years. In less sunny regions, the payback might stretch to 10 or 12 years. However, even in less sunny areas, high local electricity prices can make solar a lucrative investment. If the cost of power is high, even moderate generation provides a substantial financial hedge against inflation.
System Degradation and Long-term Financial Planning
A critical factor often overlooked in solar financial modeling is “degradative loss.” Solar panels are not static assets; their efficiency declines slightly every year. Most Tier 1 manufacturers guarantee a degradation rate of about 0.5% per year. This means that after 25 years, your “money-making machine” will still be producing approximately 86% to 90% of its original output.
When building a 25-year cash flow model for a solar project, you must account for this diminishing yield. Conversely, you must also account for the historical 3-5% annual increase in utility rates. In most scenarios, the rising cost of grid electricity far outpaces the physical degradation of the panels, meaning the value of the energy generated actually increases over time, even as the volume of energy decreases.
Solar as a Strategic Asset: Tax Credits, Rebates, and SRECs
The raw generation of electricity is only one part of the financial equation. To truly understand “how much” a solar panel is worth, one must factor in the government incentives that front-load the return on investment.
The Federal Investment Tax Credit (ITC)
In the United States, the Residential Clean Energy Credit is one of the most powerful wealth-building tools available to homeowners. Currently, it allows you to deduct 30% of the total system cost (including labor and storage) from your federal income taxes.
If a system costs $30,000, the ITC provides a $9,000 dollar-for-dollar credit. This immediately lowers the “net capital outlay,” drastically improving the ROI. From a cash-flow perspective, this credit functions like a massive, one-time dividend that can be reinvested into other assets or used to pay down the principal of a solar loan.
Net Metering and Feed-in Tariffs
How much a panel “generates” for your bank account also depends on your local Net Metering policy. Net Metering allows you to send excess energy back to the grid during the day (when you aren’t home) and receive a 1-to-1 credit on your bill for the energy you use at night.
In states with favorable net metering, the grid acts as a free battery, allowing you to “bank” the monetary value of every kWh generated. In some jurisdictions, you may also be eligible for Solar Renewable Energy Credits (SRECs). In these markets, for every 1,000 kWh (1 megawatt-hour) your system generates, you earn one credit that can be sold on an open market to utility companies. This creates a secondary, passive income stream that exists entirely independent of your own energy consumption.
Scaling Your Side Hustle: Solar for Small Business and Rental Properties
Beyond personal residences, solar generation serves as a powerful tool for business finance and property management. By reducing operating expenses (OPEX), solar directly increases the Net Operating Income (NOI) of a property, which in turn boosts its market valuation.
Boosting Property Value through Green Infrastructure
Studies from organizations like Zillow and the Lawrence Berkeley National Laboratory have consistently shown that homes with solar panels sell for a premium—often around 4% higher than comparable non-solar homes. For a $500,000 property, that is a $20,000 increase in equity.
This capital appreciation is unique because, unlike a kitchen remodel, the “value add” of solar is quantifiable. A buyer can look at the historical generation data and see exactly how much money the house will save them over the next two decades. It transforms the home from a liability (an entity that consumes cash) into a hybrid asset (an entity that generates its own utility budget).
Commercial Solar and Operating Expense Reduction
For small business owners or landlords, the electricity generated by solar panels can be a game-changer for margins. Under Section 179 of the tax code, many businesses can utilize accelerated depreciation (MACRS) to write off the cost of the solar equipment even faster than residential users.
When a commercial building generates its own power, it lowers its “break-even” point. For rental properties, landlords can either include “free” electricity in the rent to command a higher premium or use a “split incentive” model where the tenant pays a reduced rate for the solar power, creating a new revenue stream for the property owner. In both cases, the amount of electricity generated is directly proportional to the increased profitability of the enterprise.
The Bottom Line: Solar as a Hedge Against Inflation
When we ask how much electricity a solar panel generates, we are really asking about the value of energy independence. As global energy markets become increasingly volatile, the ability to “lock in” your energy costs at a fixed rate (the cost of the equipment) is a profound hedge against inflation.
Every kWh generated by your roof is a kWh you do not have to purchase from a centralized utility that is subject to fuel surcharges, transmission fees, and regulatory hikes. Over a 25-year period, a well-maintained solar array doesn’t just generate electricity; it generates financial security. By treating the initial cost not as an expense, but as a capital investment in an energy-producing asset, you can turn a mundane roof into a high-yield component of your financial portfolio. The “output” of a solar panel is, ultimately, measured in the freedom it provides from the rising costs of the traditional energy market.
aViewFromTheCave is a participant in the Amazon Services LLC Associates Program, an affiliate advertising program designed to provide a means for sites to earn advertising fees by advertising and linking to Amazon.com. Amazon, the Amazon logo, AmazonSupply, and the AmazonSupply logo are trademarks of Amazon.com, Inc. or its affiliates. As an Amazon Associate we earn affiliate commissions from qualifying purchases.