
Investing in solar energy is no longer just an environmental statement; it is a sophisticated move in personal finance and capital allocation. For the modern homeowner or business owner, the question “How many solar panels will I need?” is the starting point of a comprehensive cost-benefit analysis. This calculation determines not just the physical footprint on your roof, but the internal rate of return (IRR) on one of the most stable long-term assets available in the current market.
To treat solar as a financial instrument, one must move beyond simple surface-area estimates. You must evaluate your energy consumption as a liability and the solar array as a hedge against utility inflation. This guide explores the financial metrics, investment calculations, and strategic planning required to determine the optimal number of solar panels for your portfolio.
The Economics of Energy Consumption: Analyzing Your Current Liability
Before determining the size of your investment, you must audit the “debt” you currently owe to your utility provider. In financial terms, your monthly electricity bill is a recurring operating expense with an unpredictable interest rate—utility companies frequently hike prices based on fuel costs and grid maintenance.
Understanding Your Kilowatt-Hour (kWh) Baseline
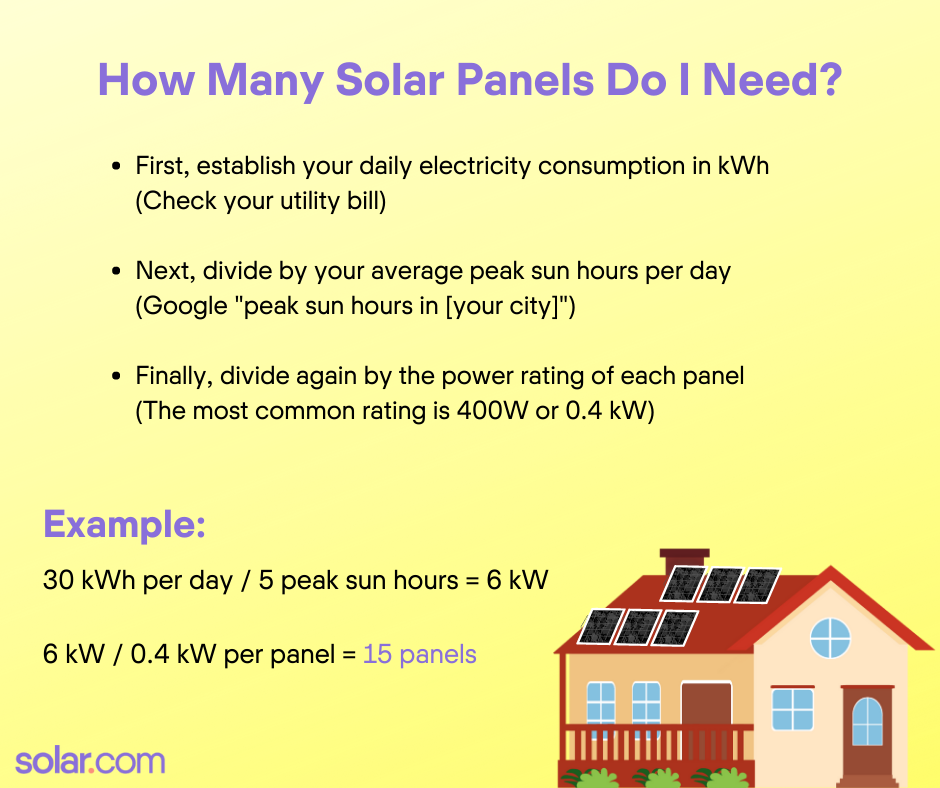
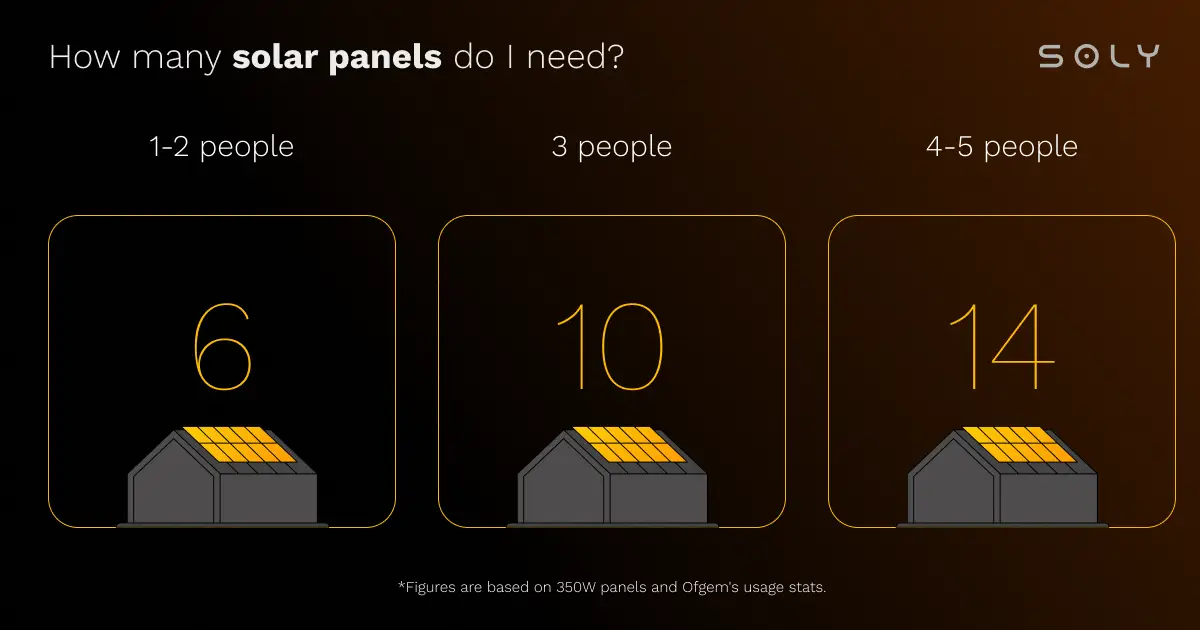
The most critical data point in your calculation is your annual energy consumption. Financial planners look at the last 12 to 24 months of utility statements to find a “normalized” average. Most American households consume roughly 10,600 kWh per year.
To determine the number of panels, you take this annual total and divide it by the expected production ratio of a single panel. However, from a money management perspective, you must also account for “lifestyle inflation.” If you plan to purchase an electric vehicle (EV) or switch from gas heating to an electric heat pump in the next three years, your “need” is not based on past data, but on projected future liabilities. Under-sizing your system results in a “residual bill,” while over-sizing can lead to diminishing returns if your local utility does not offer favorable buy-back rates.
Factoring in Future Inflation of Utility Costs
When calculating the number of panels needed, you are essentially “pre-purchasing” 25 years of electricity at today’s prices. Over the last decade, residential electricity prices in the United States have increased by an average of 2% to 3% annually. In certain volatile markets, these spikes can reach double digits. By calculating a panel count that covers 100% of your usage, you are effectively locking in a fixed cost for energy, shielding your monthly cash flow from the volatility of the energy commodity market.
Calculating the Investment Size: Panel Quantity vs. Portfolio Goals
The number of panels you install is directly correlated to your “Capital Outlay.” In the world of finance, bigger isn’t always better; “right-sizing” is the key to maximizing your Return on Investment (ROI).
Efficiency Ratings and the “Cost-Per-Watt” Metric
Not all panels are created equal. High-efficiency panels (rated at 400W or higher) require fewer units to reach your energy goals, saving on “soft costs” like labor and racking. However, these premium panels come with a higher price tag.
From a financial standpoint, you should calculate the Cost-Per-Watt (CPW). If 20 high-efficiency panels cost $20,000, but 26 standard-efficiency panels (providing the same total wattage) cost $17,000, the standard panels offer a better immediate ROI, provided you have the roof space. Your “need” is therefore defined by the intersection of your energy requirements and the most efficient allocation of your available capital.
The Impact of Geographic Location on Yield
In finance, location determines the “yield” of an asset. In solar, this is known as the “production ratio.” A panel in Arizona will produce significantly more energy—and thus more financial value—than the same panel in Washington state due to “peak sun hours.”
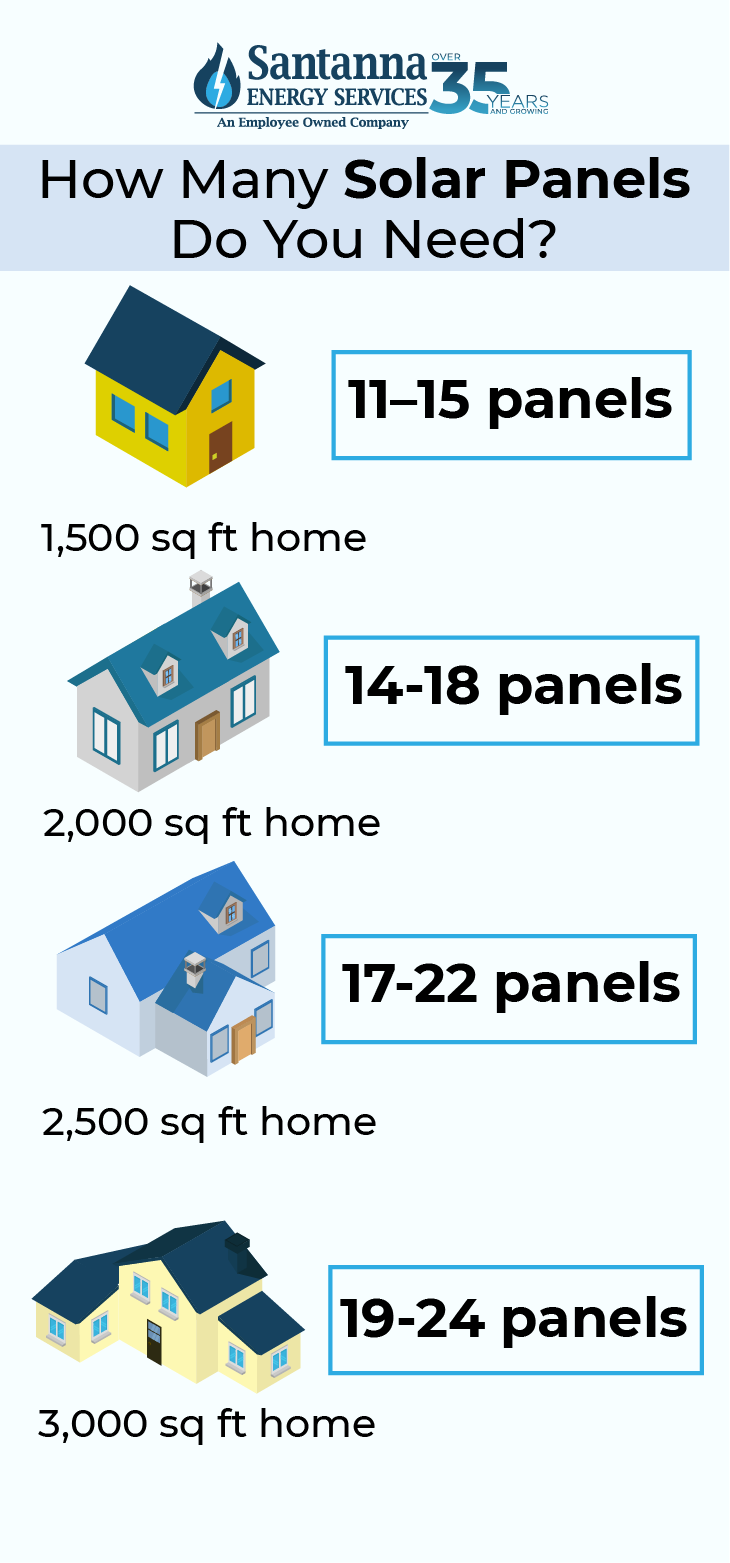
If you live in a high-sunlight region, you may only need 18 panels to offset a $150 monthly bill. In a lower-sunlight region, you might need 25 panels to achieve the same financial result. Understanding your local “insolation” (solar radiation) is equivalent to understanding the dividend yield on a stock; it tells you exactly how much “revenue” each panel will generate for your household.
Right-Sizing for Net Metering Optimization
Many investors make the mistake of over-investing in solar panels, assuming the utility will pay them handsomely for excess power. This is rarely the case. Most utilities use “Net Metering,” where they credit you 1:1 for the power you send back, but only up to the amount you consume.
If you install more panels than you need to cover your annual usage, the utility may only pay you the “wholesale” rate for the excess—which is often a fraction of the retail rate. From a wealth-management perspective, over-sizing beyond 100%–110% of your needs is a poor use of capital with a very low marginal return.
Financing Your Solar Asset: ROI and Payback Periods
Once you have identified the number of panels required to offset your costs, the next step is determining how to fund the acquisition. Solar panels are a unique asset because they are one of the few home improvements that offer a direct, measurable cash yield.
Initial Capital Outlay vs. Long-Term Cash Flow
There are three primary ways to acquire your panels: cash purchase, solar loan, or lease/PPA (Power Purchase Agreement).
- Cash Purchase: Offers the highest total ROI and the shortest “payback period” (typically 6 to 9 years).
- Solar Loan: Allows for “zero-down” financing where the monthly loan payment is often lower than the previous utility bill, creating “Day 1” positive cash flow.
- Leasing: Generally the least attractive from a wealth-building perspective, as the third-party owner retains the tax incentives and the long-term equity.
Tax Incentives and Federal Credits (ITC)
The most powerful tool in the solar financial kit is the Federal Investment Tax Credit (ITC). Currently, the government allows you to deduct 30% of the total cost of your solar system from your federal taxes.
If your “needed” system of 25 panels costs $25,000, the federal government effectively provides a $7,500 rebate in the form of a tax credit. This drastically reduces the “net cost” of the asset and accelerates the break-even point. When calculating how many panels you can afford, always calculate based on the net cost after the 30% credit, rather than the gross sticker price.
Real Estate Value Appreciation
Beyond monthly savings, the number of panels you install adds tangible value to your real estate portfolio. Studies by organizations like Zillow and the Lawrence Berkeley National Laboratory have shown that solar-equipped homes sell for a premium—often around 4% higher than non-solar homes. This makes solar a “dual-purpose” investment: it provides monthly “dividends” through energy savings and “capital gains” through increased property value.
Operational Costs and Maintenance for Maximum Yield
Like any financial portfolio, a solar array requires monitoring to ensure it meets its projected performance targets. The “number of panels” is a static figure, but their output is dynamic.
Degradation Rates and Long-Term Performance
Solar panels are not permanent machines; they are depreciating assets. Most high-quality panels have a degradation rate of about 0.5% per year. This means that in year 20, your 25-panel system will produce about 90% of what it did in year one.
When deciding “how many panels I need,” a savvy investor builds in a “margin of safety.” By installing 5% to 10% more capacity than currently required, you ensure that even after two decades of degradation, the system still covers your baseline energy needs, maintaining your independence from the utility grid.
Opportunity Cost and Reinvestment Strategies
Finally, the decision to install a specific number of panels should involve an “opportunity cost” analysis. If spending an extra $5,000 to add 6 more panels saves you an additional $40 per month, you are looking at an annual return of approximately 9.6%.
Compare this to other investment vehicles. If the S&P 500 averages 7% to 10% annually, a solar expansion that yields a guaranteed, tax-free 9.6% return is an incredibly competitive allocation of capital. Unlike stocks, the “dividends” from solar panels (the saved energy costs) are not subject to income tax, making the effective yield even higher.
Conclusion: The Final Calculation
Determining how many solar panels you need is far more than a spatial puzzle; it is an exercise in financial engineering. By analyzing your kWh consumption as a liability, treating your roof as a yield-generating asset, and leveraging federal tax incentives, you can transform a standard home utility into a source of long-term wealth.
The optimal number of panels is the amount that maximizes your “Net Present Value” (NPV)—the point where the cost of the hardware is most efficiently offset by the 25-year stream of tax-free energy savings. Whether you need 15 panels or 50, the goal remains the same: to transition from a consumer of energy to a producer of value, securing your financial future against the rising costs of the traditional power grid.
aViewFromTheCave is a participant in the Amazon Services LLC Associates Program, an affiliate advertising program designed to provide a means for sites to earn advertising fees by advertising and linking to Amazon.com. Amazon, the Amazon logo, AmazonSupply, and the AmazonSupply logo are trademarks of Amazon.com, Inc. or its affiliates. As an Amazon Associate we earn affiliate commissions from qualifying purchases.