
In the world of finance, few acronyms carry as much weight as CPI. Whether you are a retail investor, a corporate CFO, or someone trying to manage a household budget, the Consumer Price Index (CPI) serves as the primary compass for navigating the economy. It is the most widely used measure of inflation and, by extension, the most significant indicator of the “real” value of your money.
Understanding how to find CPI, how it is calculated, and—most importantly—how to interpret its data is essential for maintaining purchasing power. In an era where fiscal policy and market volatility are at the forefront of the news cycle, being able to dissect CPI reports allows you to make informed decisions regarding investments, savings, and debt management.
Decoding the CPI: The Fundamentals of Measurement
To find the Consumer Price Index, one must first understand what it represents. At its core, the CPI measures the average change over time in the prices paid by urban consumers for a market basket of consumer goods and services. It is not a measure of the absolute price of a single item, but rather a statistical estimate constructed using the prices of a sample of representative items whose prices are collected periodically.
Defining the Market Basket
The “market basket” is the foundation of the CPI. This basket is developed from detailed spending information provided by families and individuals on what they actually bought. It is categorized into eight major groups:
- Food and Beverages: Cereal, milk, coffee, chicken, wine, and service at full-service restaurants.
- Housing: Rent of primary residence, owners’ equivalent rent, fuel oil, and bedroom furniture.
- Apparel: Men’s shirts and sweaters, women’s dresses, and jewelry.
- Transportation: New vehicles, airline fares, gasoline, and motor vehicle insurance.
- Medical Care: Prescription drugs and medical supplies, physicians’ services, eyeglasses and eye care, and hospital services.
- Recreation: Televisions, toys, pets and pet products, sports equipment, and admissions.
- Education and Communication: College tuition, postage, telephone services, and computer software and accessories.
- Other Goods and Services: Tobacco and smoking products, haircuts and other personal services, and funeral expenses.
The Mathematical Formula
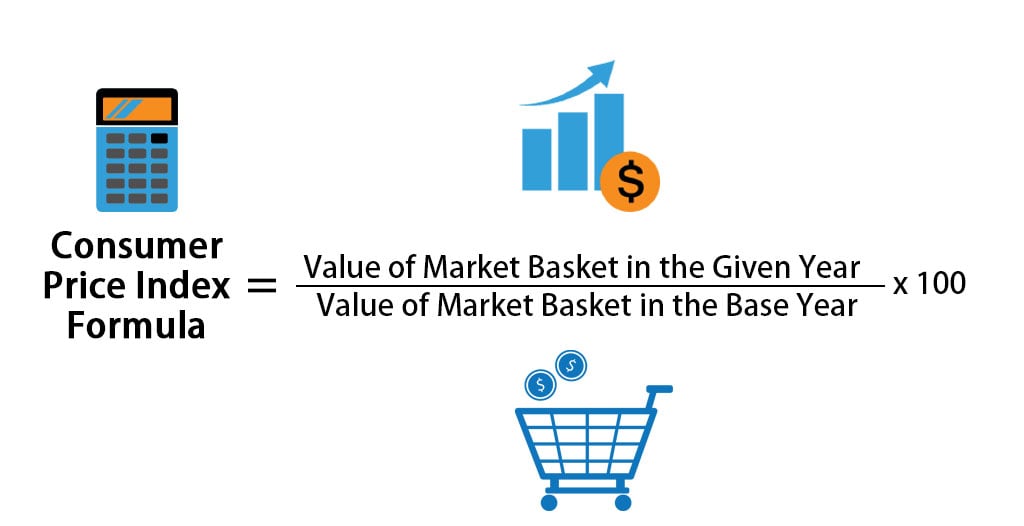
While government agencies do the heavy lifting, understanding the formula helps you find the logic behind the numbers. The CPI for a specific period is calculated by taking the cost of the market basket in the current year, dividing it by the cost of the same basket in a “base year,” and then multiplying by 100.
CPI = (Cost of Basket in Current Period / Cost of Basket in Base Period) x 100
The percentage change between two periods represents the inflation rate. For example, if the CPI rises from 100 to 105, inflation is 5%.
Where to Find Reliable CPI Data and Reports
Finding the CPI is relatively straightforward if you know which primary sources to trust. Because this data is used to adjust Social Security payments and trigger interest rate changes by central banks, it is published with a high degree of transparency.
The Bureau of Labor Statistics (BLS)
In the United States, the Bureau of Labor Statistics is the primary authority. Every month, usually around the second week, the BLS releases the Consumer Price Index Summary. This report is the “gold standard” for financial analysts. You can find this data directly on the BLS website (bls.gov), where they provide historical data tables, interactive charts, and regional breakdowns.
For global investors, finding CPI data for other nations requires looking at their respective national statistics offices, such as the Office for National Statistics (ONS) in the UK or Eurostat for the European Union.
Financial Market Platforms and Real-Time Trackers
For those who need to find CPI data in the context of market movements, financial terminals like Bloomberg or Reuters are the go-to tools for professionals. However, for the average investor, websites like Investing.com, Trading Economics, and the St. Louis Fed’s FRED (Federal Reserve Economic Data) database offer excellent, free visualizations of CPI trends. These platforms often provide the “Economic Calendar,” which lists the exact date and time of upcoming CPI releases—an essential tool for day traders and swing investors who want to anticipate market volatility.
Why Finding CPI Matters for Your Investment Portfolio

Finding and tracking the CPI is not just an academic exercise; it is a vital part of risk management in investing. Inflation is often called the “silent thief” because it erodes the real value of cash and fixed-income returns.
The Relationship Between CPI and Interest Rates
The Federal Reserve and other central banks use CPI as their primary signal for monetary policy. If the CPI indicates that inflation is rising too quickly (exceeding their typical 2% target), they may raise interest rates to cool the economy. For investors, this means that a high CPI reading often leads to a drop in bond prices and can create volatility in the stock market, particularly for high-growth tech stocks that are sensitive to borrowing costs.
Real Returns vs. Nominal Gains
To find your “real” rate of return on an investment, you must subtract the CPI from your nominal return. If your savings account offers a 4% interest rate, but the CPI shows inflation is at 5%, you are effectively losing 1% of your purchasing power every year. By tracking CPI, investors can pivot toward assets that historically hedge against inflation, such as real estate, commodities, or Treasury Inflation-Protected Securities (TIPS).
How to Use CPI Data for Personal Financial Planning
Beyond the stock market, CPI data is a practical tool for managing your personal economy. It provides a benchmark for whether your income is keeping pace with the cost of living.
Adjusting Your Budget for Cost-of-Living Increases
A rising CPI means your “staples”—groceries, electricity, and rent—are becoming more expensive. By finding the CPI breakdown for specific categories (like “Food at Home”), you can identify exactly where your budget is being squeezed. If the “Transportation” component of the CPI is spiking due to gasoline prices, it might be the time to consider a hybrid vehicle or public transit to mitigate the impact on your personal finances.
Salary Negotiations and Inflation
One of the most powerful ways to use CPI data is during an annual performance review. If the CPI has risen by 6% over the past year and your employer offers a 3% raise, you are technically receiving a pay cut in terms of purchasing power. Finding the official CPI data allows you to enter negotiations with a data-backed argument for a Cost-of-Living Adjustment (COLA).
Beyond the Headline: Understanding Core CPI and Regional Variations
When you look for the CPI in news headlines, you will often see two different numbers: “Headline CPI” and “Core CPI.” Understanding the distinction is crucial for a sophisticated financial outlook.
Headline vs. Core CPI
Headline CPI includes every category in the market basket, including food and energy. However, food and energy prices are notoriously volatile and can be influenced by temporary factors like geopolitical conflicts or weather events.
Core CPI, on the other hand, excludes food and energy. Economists and the Federal Reserve often prefer Core CPI because it provides a clearer picture of the long-term underlying inflation trend. For a consumer, Headline CPI is what you feel at the pump and the grocery store, but for an investor trying to predict central bank policy, Core CPI is the number to watch.
Regional Price Indices
The national CPI is an average, but your personal “inflation experience” depends heavily on where you live. The BLS provides regional CPI data for major metropolitan areas. For instance, the cost of housing might be skyrocketing in the New York-Newark-Jersey City area while remaining stable in the Midwest. If you are considering a career move or retirement, finding the regional CPI can help you determine if a higher salary in a new city actually translates to a better standard of living.

Conclusion: Mastering the CPI for Financial Success
Finding the CPI is the first step toward economic literacy. In a financial landscape where the value of currency is constantly shifting, the Consumer Price Index provides the necessary context to evaluate wealth. By regularly monitoring BLS reports, understanding the difference between headline and core figures, and applying that data to your investment and budgeting strategies, you can protect your assets from the erosive effects of inflation.
In the end, the CPI is more than just a government statistic; it is a tool for empowerment. Whether you are adjusting your portfolio to include inflation-resistant assets or negotiating a salary that reflects the current economic reality, your ability to find and interpret CPI data is a cornerstone of long-term financial security. Keep a close eye on the index, and you will never be blindsided by the changing value of the dollar.
aViewFromTheCave is a participant in the Amazon Services LLC Associates Program, an affiliate advertising program designed to provide a means for sites to earn advertising fees by advertising and linking to Amazon.com. Amazon, the Amazon logo, AmazonSupply, and the AmazonSupply logo are trademarks of Amazon.com, Inc. or its affiliates. As an Amazon Associate we earn affiliate commissions from qualifying purchases.