Understanding the economy can often feel like deciphering a complex code, filled with acronyms and abstract concepts. Yet, some of these concepts are fundamental to navigating our financial lives, from managing personal budgets to making informed investment decisions. Among the most crucial of these is the price index. Far from being a mere academic exercise, calculating the price index is a cornerstone of economic analysis, providing vital insights into inflation, purchasing power, and the overall health of an economy. It’s the mechanism through which we gauge how the cost of living changes over time, impacting everyone from individual consumers to multinational corporations. For those looking to master their finances, grasp the implications of economic news, or simply understand the real value of their money, knowing how a price index is calculated and what it signifies is indispensable. This guide delves into the methodologies, common applications, and inherent challenges in creating these powerful financial tools.
Understanding the Core Concept of a Price Index
At its heart, a price index is a statistical measure designed to show the average change in prices of a specific basket of goods and services over time. It provides a snapshot of how prices are evolving, offering a standardized way to compare price levels from one period to another. Without it, tracking inflation or deflation would be a qualitative guess rather than a precise measurement.
What is a Price Index?
A price index quantifies the relative change in price levels between a base period and a comparison period. It simplifies a vast array of individual price changes into a single, representative number. Imagine a shopping cart filled with everyday items—groceries, fuel, clothing, entertainment, housing costs, and medical services. A price index tracks how the total cost of this same basket of goods and services changes over months or years. If the index rises, it means the average cost of that basket has increased, indicating inflation. Conversely, a fall suggests deflation. This standardized measurement allows economists, policymakers, businesses, and individuals to make informed decisions based on real economic trends, rather than anecdotal evidence.
Why Price Indexes Matter for Individuals and Businesses
The implications of price indexes ripple through every facet of the financial world. For personal finance, understanding the price index, particularly the Consumer Price Index (CPI), is critical. It helps individuals assess their real income—how much they can actually buy with their earnings—rather than just their nominal income. If wages rise by 2%, but the price index indicates inflation of 4%, an individual’s purchasing power has effectively decreased, meaning they are worse off. This knowledge is crucial for budgeting, retirement planning, and making informed decisions about major purchases.
For investors, price indexes are key to determining real returns. A stock might show a 10% gain, but if inflation was 7% during the same period, the real return is only 3%. This distinction is vital for preserving wealth and achieving financial goals. It also influences decisions regarding asset allocation, as certain assets perform differently in inflationary or deflationary environments.
Businesses rely on price indexes for various strategic decisions. They use them to adjust pricing strategies, manage input costs, and negotiate supplier contracts. For example, if the Producer Price Index (PPI) shows rising input costs, businesses might need to adjust their selling prices to maintain profit margins. Price indexes also play a role in wage negotiations and cost-of-living adjustments (COLAs) for employees, ensuring fairness and maintaining employee purchasing power.
At a broader level, governments and central banks meticulously monitor price indexes to formulate monetary policy, set interest rates, and design fiscal strategies. A persistently high inflation rate, as indicated by price indexes, might prompt a central bank to raise interest rates to cool down the economy, impacting everything from mortgage rates to business loans. Price indexes are, therefore, not just statistical curiosities but powerful tools that inform critical financial and economic decisions daily.
Key Methodologies for Calculating Price Indexes
While the concept of a price index is straightforward, its calculation involves specific methodologies, each with its own assumptions and implications. The most common approaches are the Laspeyres, Paasche, and Fisher Ideal indexes, primarily differing in how they weigh the quantities of goods and services in the basket.
The Laspeyres Price Index: A Base-Period Quantity Approach
The Laspeyres Price Index is perhaps the most intuitive and widely used method for measuring price changes. It calculates the cost of a fixed “basket” of goods and services from a base period, then measures how the cost of that identical basket changes in subsequent periods. This means the quantities of goods and services consumed are held constant at their base-period levels.
The formula for the Laspeyres Price Index (L) is:
$L = (sum (Pt times Q0) / sum (P0 times Q0)) times 100$
Where:
- $P_t$ = Price of a good/service in the current period
- $Q_0$ = Quantity of a good/service in the base period
- $P_0$ = Price of a good/service in the base period
- $sum$ denotes the sum across all goods and services in the basket
Pros: The primary advantage of the Laspeyres index is its simplicity and ease of comparison over time. Since the quantities ($Q_0$) are fixed, any change in the index directly reflects a change in prices. This makes it straightforward to track inflation consistently.
Cons: The main drawback is its tendency to overestimate inflation due to what is known as “substitution bias.” When the price of a good rises, consumers often substitute it with a cheaper alternative. Because the Laspeyres index assumes consumers continue to buy the original, more expensive quantities, it fails to capture this behavioral change, thus overstating the actual increase in the cost of living. It also struggles to incorporate new goods or quality improvements.
The Paasche Price Index: A Current-Period Quantity Approach
In contrast to the Laspeyres index, the Paasche Price Index updates the quantities in the basket to reflect current consumption patterns. It measures the current cost of a basket of goods and services using current period quantities ($Q_t$) and compares it to what the cost of that same current-period basket would have been in the base period.
The formula for the Paasche Price Index (P) is:
$P = (sum (Pt times Qt) / sum (P0 times Qt)) times 100$
Where:
- $P_t$ = Price of a good/service in the current period
- $Q_t$ = Quantity of a good/service in the current period
- $P_0$ = Price of a good/service in the base period
- $sum$ denotes the sum across all goods and services in the basket
Pros: The Paasche index accounts for the substitution effect to some extent, as it uses current quantities. If consumers switch to cheaper goods, these lower quantities will be reflected in the index, potentially offering a more accurate measure of the actual cost of living in the present.
Cons: Its main limitation is that it tends to underestimate inflation. By using current quantities, it implies that people are already buying cheaper alternatives, making the “cost” of the original base-period consumption appear lower. Furthermore, comparing Paasche indexes across multiple periods becomes challenging because the basket of goods ($Q_t$) changes in each period, making direct historical comparisons difficult. This also makes data collection for the Paasche index more intensive, as current consumption data must be constantly updated.
The Fisher Ideal Index: A Geometric Mean Compromise
Recognizing the biases inherent in both the Laspeyres and Paasche indexes, economists developed the Fisher Ideal Index. This index aims to provide a more accurate measure of price changes by taking the geometric mean of the Laspeyres and Paasche indexes. It essentially averages out the potential overestimation of Laspeyres and the underestimation of Paasche.
The formula for the Fisher Ideal Index (F) is:

$F = sqrt{L times P}$
Where:
- L = Laspeyres Price Index
- P = Paasche Price Index
Pros: The Fisher Ideal Index is considered a “superlative” index because it satisfies several desirable theoretical properties for measuring true cost-of-living changes. It largely mitigates the substitution bias and provides a more robust and symmetrical measure of price change. Many national statistical agencies prefer this index for its accuracy, even if they report Laspeyres-type indexes for simplicity.
Cons: The primary disadvantage is its complexity. Calculating the Fisher index requires all the data necessary for both the Laspeyres and Paasche indexes, making it more data-intensive and computationally demanding. This can lead to delays in reporting. Despite this, its accuracy often justifies the additional effort.
Practical Applications and Common Price Indexes
Beyond the theoretical calculations, price indexes manifest in several forms that directly influence our financial world. These specialized indexes track different aspects of the economy, providing tailored insights for various stakeholders.
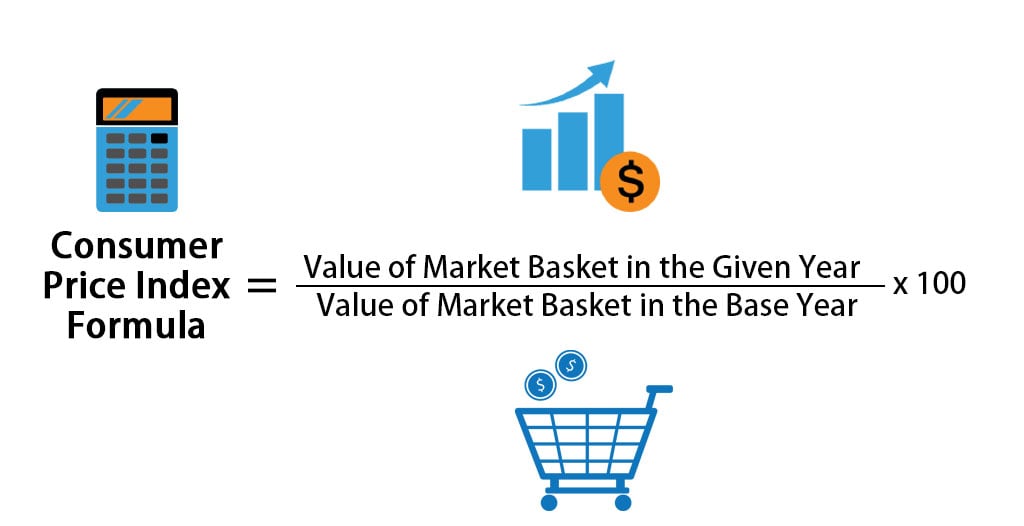
The Consumer Price Index (CPI): Your Daily Inflation Barometer
The Consumer Price Index (CPI) is arguably the most recognized and influential price index globally. It measures the average change over time in the prices paid by urban consumers for a market basket of consumer goods and services. This “market basket” includes a wide range of categories such as food and beverages, housing, apparel, transportation, medical care, recreation, education and communication, and other goods and services. In the U.S., the Bureau of Labor Statistics (BLS) is responsible for calculating and publishing the CPI.
The CPI is a crucial indicator for several reasons:
- Inflation Gauge: It is the primary measure of inflation experienced by households, influencing economic policy decisions, particularly those made by central banks.
- Cost-of-Living Adjustments (COLAs): Many labor contracts, social security benefits, and pension payments are indexed to the CPI to ensure that the purchasing power of these incomes keeps pace with inflation.
- Economic Analysis: Businesses use CPI data to inform pricing strategies, market analysis, and wage negotiations. Investors use it to gauge the real rate of return on investments.
While the CPI is typically a modified Laspeyres-type index, statistical agencies employ sophisticated methods, including hedonic adjustments (discussed later), to reduce its inherent biases and make it more accurate.
The Producer Price Index (PPI): A Look at Wholesale Inflation
Unlike the CPI, which focuses on prices paid by consumers, the Producer Price Index (PPI) measures the average change over time in the selling prices received by domestic producers for their output. It encompasses prices at different stages of production, from raw materials to intermediate goods to finished goods. The BLS also publishes various PPIs, categorized by industry and commodity.
The PPI serves as an early warning system for consumer inflation:
- Leading Indicator: Changes in producer prices often precede changes in consumer prices. If manufacturers’ costs are rising, they are likely to pass those costs on to consumers eventually.
- Business Decisions: Businesses use PPI data to understand trends in input costs, inform purchasing decisions, and set pricing for their products and services.
- Economic Analysis: Economists analyze the PPI to identify inflationary pressures originating within the production process, providing insights into supply-side dynamics.
The GDP Deflator: Broadest Measure of Economy-Wide Prices
The Gross Domestic Product (GDP) Deflator is the broadest measure of price changes in an economy. It measures the price changes of all new, domestically produced, final goods and services included in the GDP. This means it covers not only consumer goods but also investment goods, government purchases, and net exports.
Key characteristics of the GDP Deflator:
- Comprehensive Scope: It is more comprehensive than the CPI because it includes all goods and services produced domestically, not just those purchased by urban consumers. This includes items like large machinery, infrastructure projects, and military equipment.
- Paasche-Like Nature: The GDP deflator implicitly reflects a Paasche-like calculation, as the weights for each good and service in the calculation are constantly changing to reflect the current composition of GDP. This means it naturally accounts for shifts in the economy’s output mix.
- Reflects Economic Structure: Because its basket is the entire GDP, it provides a picture of economy-wide inflation that reflects the actual production and consumption patterns of the period.
Each of these indexes offers a unique perspective on price movements, collectively providing a comprehensive view of inflationary and deflationary trends essential for sound financial planning and economic management.
Challenges and Nuances in Price Index Calculation
While price indexes are invaluable, their calculation is not without significant challenges. These complexities arise from the dynamic nature of markets, consumer behavior, and technological advancements, requiring continuous refinement of methodologies.
Quality Adjustments and Hedonic Pricing
One of the most profound challenges in calculating price indexes is accounting for changes in the quality of goods and services over time. A smartphone today, for instance, offers vastly superior capabilities compared to one from a decade ago, even if its nominal price has remained similar or even decreased. Simply comparing the price of a “smartphone” across years without considering these improvements would misrepresent the true cost. A higher price for a demonstrably better product is not necessarily pure inflation; it reflects an increase in value.
To address this, statistical agencies employ quality adjustments. One sophisticated method is hedonic pricing, which attempts to decompose a product into its constituent characteristics (e.g., processor speed, screen resolution, camera megapixels for a phone) and estimate the value of each characteristic. This allows economists to adjust the price of a product for changes in its quality, isolating the “pure” price change from the change in utility or performance. Without such adjustments, price indexes could either overestimate inflation (if product quality improves significantly but prices remain constant) or underestimate it (if product quality deteriorates while prices remain constant).
Substitution Bias and New Goods Bias
As discussed with the Laspeyres index, substitution bias is a significant concern. When the price of a particular good or service rises, consumers often respond by substituting it with a relatively cheaper alternative. For example, if beef prices surge, consumers might buy more chicken or pork. A fixed-basket index, like a pure Laspeyres index, would continue to price the original, more expensive beef quantities, thereby overstating the actual increase in the cost of living. Statistical agencies often use chained indexes (like the chained CPI) or update the basket of goods more frequently to mitigate this bias, allowing for a more accurate reflection of consumer behavior.
Another pervasive issue is new goods bias. The economy constantly introduces entirely new products and services (e.g., streaming services, electric vehicles, AI tools) that were not part of the original “basket.” Incorporating these new goods into the price index in a timely and accurate manner is crucial. Often, when new goods are introduced, they start with high prices, which then fall dramatically as production scales and competition increases. If these goods are only added to the index after their prices have already dropped significantly, the index might miss the initial period of rapid price decline, leading to an overestimation of inflation over the long run. Identifying and integrating new, impactful goods into the consumption basket poses a continuous challenge for index compilers.
Weighting and Basket Updates
The “basket of goods” used in a price index is not static; it must be periodically updated to reflect changes in consumer spending patterns. Over time, consumption habits evolve due to technological advancements, demographic shifts, and cultural trends. For example, spending on landline phones has dramatically decreased, while spending on mobile data plans has soared. If the weights assigned to these categories in the index are not updated, the index will become less representative of actual household expenditures.
Statistical agencies regularly revise the weights of different categories within their price indexes. This involves conducting large-scale consumer expenditure surveys to determine how households are allocating their spending. These updates ensure that the index remains relevant and accurately reflects the current cost of living. However, the process of updating weights is resource-intensive and can introduce breaks in the continuity of historical data, making long-term comparisons more complex. Balancing representativeness with data comparability is a continuous task for those who calculate and maintain price indexes.
In conclusion, while the calculation of price indexes relies on sophisticated mathematical models, the real-world application demands constant vigilance and adaptation to capture the complex, ever-evolving nature of economic activity. These challenges underscore the dedication required to produce accurate and insightful economic data for financial decision-making.
Price indexes are more than just numbers; they are powerful lenses through which we view the financial world. From the simple concept of tracking the cost of a basket of goods to the sophisticated methodologies employed by national statistical agencies, understanding how these indexes are calculated demystifies a crucial aspect of macroeconomics and personal finance. Whether it’s the CPI guiding our budgeting, the PPI hinting at future market shifts, or the GDP Deflator offering a holistic view of the economy, these tools are indispensable for navigating inflation, assessing purchasing power, and making informed decisions in an increasingly complex financial landscape. By grasping the fundamentals of price index calculation, individuals and businesses alike can gain a deeper understanding of economic realities, empowering them to manage their money more effectively and strategically plan for the future.
aViewFromTheCave is a participant in the Amazon Services LLC Associates Program, an affiliate advertising program designed to provide a means for sites to earn advertising fees by advertising and linking to Amazon.com. Amazon, the Amazon logo, AmazonSupply, and the AmazonSupply logo are trademarks of Amazon.com, Inc. or its affiliates. As an Amazon Associate we earn affiliate commissions from qualifying purchases.