
In the world of finance, numbers are the primary language of communication. However, raw data often fails to tell the complete story. If an investor earns $1,000 on a trade, is that a success? Without knowing the initial investment, the figure is meaningless. If a corporation increases its revenue by $1 million, is the CEO performing well? Without knowing the previous year’s performance, the context is missing.
The percentage change between two numbers is the bridge that connects raw data to actionable insight. It is the most vital tool in the “Money” niche, used by day traders, corporate accountants, and personal savers alike to measure progress, evaluate risk, and project future wealth. This article explores the mechanics of percentage change through the lens of financial mastery, offering a comprehensive guide on how to utilize this metric to optimize your economic standing.

The Fundamentals of Percentage Change in Finance
At its core, percentage change represents the relative difference between an old value and a new value. In the context of money, this usually refers to the growth or contraction of an asset, a budget, or a revenue stream.
The Mathematical Blueprint for Wealth Analysis
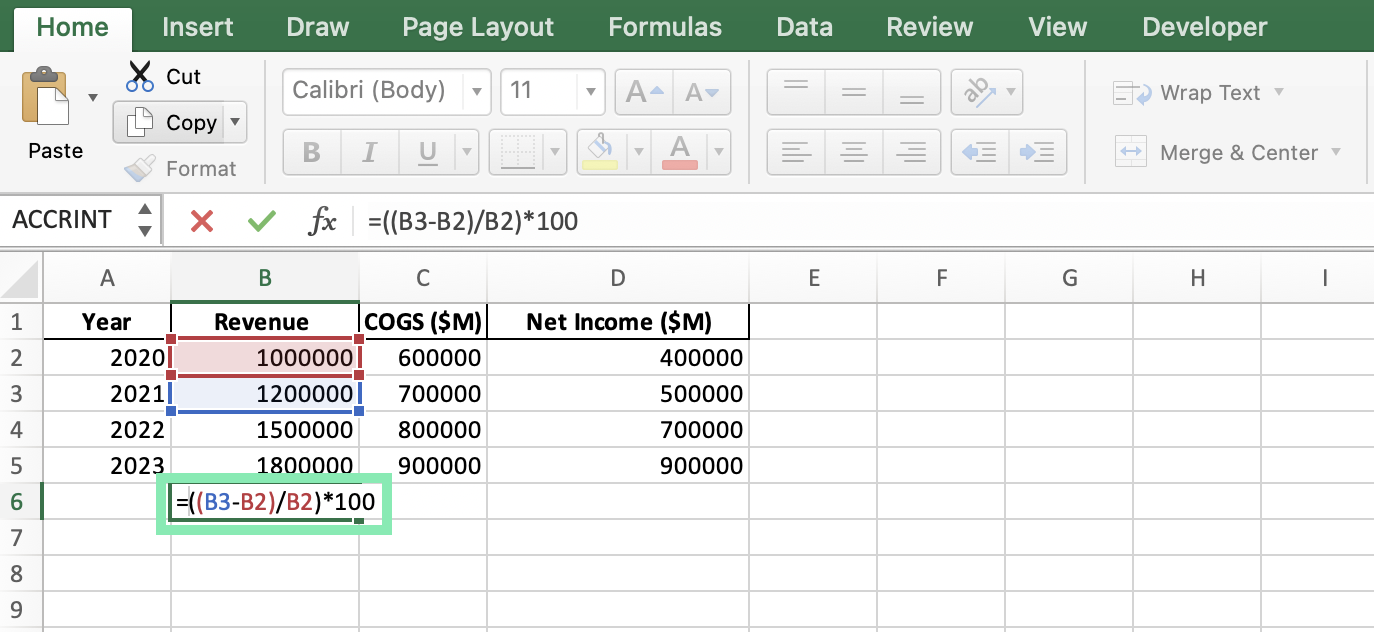
To calculate the percentage change, one must follow a specific logical sequence:
- Subtract the original value (V1) from the new value (V2).
- Divide that result by the absolute value of the original value (V1).
- Multiply by 100 to convert the decimal into a percentage.
The formula looks like this: [(New Value – Old Value) / |Old Value|] × 100.
In finance, a positive result indicates growth (appreciation), while a negative result indicates a loss (depreciation). Understanding this formula is the first step toward financial literacy, as it allows individuals to strip away the “noise” of large numbers and focus on the rate of movement.
Why Percentage Change Trumps Absolute Figures
Why do professionals prioritize percentage change over absolute dollar amounts? The answer lies in scalability and relativity. If a small-cap stock increases by $5, it might represent a 50% gain. If a mega-cap stock like Berkshire Hathaway increases by $5, it represents a statistically insignificant move.
By focusing on percentage change, investors can compare apples to oranges. It allows a venture capitalist to compare the performance of a startup to the performance of the S&P 500. It provides a universal benchmark that levels the playing field, ensuring that capital is allocated where it is most efficient, regardless of the size of the initial investment.
Applying Percentage Change to Investment Portfolios
For the individual investor or the institutional fund manager, percentage change is the primary metric for evaluating performance and managing risk. It is the pulse of the portfolio.
Calculating ROI (Return on Investment)
The most common application of percentage change is the calculation of Return on Investment (ROI). Whether you are flipping real estate, holding dividend stocks, or trading cryptocurrencies, your success is measured by the percentage increase of your principal capital.
For example, if you purchase a rental property for $300,000 and sell it five years later for $450,000, your absolute profit is $150,000. However, your percentage change (ROI) is 50%. This 50% figure is what you will use to determine if that investment was superior to placing that same $300,000 into a high-yield index fund. Without calculating the percentage change, you cannot effectively judge the opportunity cost of your capital.
Understanding Volatility through Percentage Variance
Risk management is largely the study of percentage variance. Volatility is defined by how much a price swings in terms of percentage over a given period. A “stable” asset might have a daily percentage change of 0.5%, whereas a “volatile” asset might swing by 10% or more.
By analyzing the historical percentage changes of an asset, investors can calculate the Standard Deviation—a key component in determining the risk profile of a portfolio. If the percentage changes are wild and unpredictable, the asset requires a higher risk premium. Professional money managers use these percentage metrics to balance portfolios, ensuring that one volatile asset doesn’t cause a catastrophic percentage drop in the total fund value.
The Compounding Effect of Percentage Gains
The “magic” of wealth building—compounding—is entirely dependent on consistent percentage growth. If a portfolio grows by 7% every year, it doesn’t just add 7% of the original amount; it adds 7% of the new, larger amount. This exponential growth is why a small percentage change in interest rates or annual returns can result in a difference of hundreds of thousands of dollars over a thirty-year retirement horizon. Understanding the math of percentage change helps investors realize that even a 1% difference in management fees can significantly erode their long-term wealth.
Percentage Change in Business Operations and Corporate Finance
In the corporate world, percentage change is the metric of accountability. From quarterly earnings reports to internal audits, businesses use these figures to signal health to shareholders and efficiency to management.

Revenue and Profit Growth Year-over-Year (YoY)
Publicly traded companies are judged by their “Year-over-Year” (YoY) and “Quarter-over-Quarter” (QoQ) growth. When a company reports its earnings, the market rarely cares about the total revenue in isolation. Instead, the market reacts to the percentage change compared to the previous period.
If a company earns $10 billion but that represents a -5% change from the previous year, the stock price will likely tumble. Conversely, a tech startup might lose $1 million, but if that loss is a 50% improvement over last year’s $2 million loss, the business is seen as moving toward profitability. These percentage-based trends tell the story of a company’s trajectory more accurately than any single balance sheet snapshot.
Analyzing Profit Margins and Cost Reductions
Corporate finance also utilizes percentage change to measure internal efficiency. “Margin expansion” is a term used when a company’s profit grows at a faster percentage rate than its revenue. This indicates that the company is becoming more efficient at controlling costs.
For instance, if a manufacturer reduces its cost of goods sold (COGS) from $10 per unit to $8 per unit, that is a 20% cost reduction. While $2 seems small, a 20% improvement in efficiency across millions of units can transform the financial health of the organization. Executives use these percentage markers to set KPIs (Key Performance Indicators) and drive departmental improvements.
Navigating Personal Finance with Percentage Analysis
On an individual level, mastering the percentage change between two numbers is the secret to effective budgeting and long-term financial security. It shifts the mindset from “how much do I have” to “how fast am I growing.”
Managing Inflation and Purchasing Power
Inflation is perhaps the most important percentage change in the lives of everyday consumers. It represents the percentage increase in the price of goods and services over time. If your annual salary increases by 3%, but the Consumer Price Index (CPI) shows an inflation percentage change of 5%, you have effectively received a 2% pay cut in terms of purchasing power.
By understanding this relationship, individuals can negotiate better salaries and choose investments that outpace inflation. If you aren’t tracking the percentage change of your expenses versus the percentage change of your income, you are flying blind in your financial life.
Budgeting Adjustments and Savings Rate Progress
The “Savings Rate” is a percentage-based metric that determines how quickly one can reach financial independence. It is calculated as the percentage change between your total income and your total expenses.
If a household earns $5,000 a month and saves $500, they have a 10% savings rate. If they optimize their budget and increase their savings to $1,000, they haven’t just saved an extra $500; they have achieved a 100% increase in their savings rate. This shift in perspective encourages more aggressive financial goals and helps individuals visualize their path to wealth more clearly.
Common Pitfalls and Advanced Financial Contexts
While the math of percentage change is straightforward, the interpretation of those numbers can be deceptive. In finance, there are several “traps” that even seasoned professionals must avoid.
The Asymmetry of Gains and Losses
One of the most critical concepts in money management is the mathematical asymmetry of percentage changes. A 50% loss requires a 100% gain just to get back to “even.”
Consider this: If you have $100 and lose 50%, you are left with $50. To get back to $100, you must gain $50. However, $50 is 100% of your current $50 balance. This is why capital preservation is the first rule of investing. Understanding this mathematical reality changes how an investor views risk; it highlights why avoiding a large percentage drop is often more important than chasing a large percentage gain.
Distinguishing Between Percentage Points and Percent Change
In financial news, these two terms are often confused, leading to significant errors in analysis. If an interest rate moves from 2% to 3%, it has increased by one percentage point, but it has experienced a 50% increase in value.
For a homeowner with a variable-rate mortgage, that “1%” move isn’t a 1% increase in their payment; it is a massive 50% increase in the interest portion of their debt. Being able to distinguish between a change in “points” and a “percentage change” is vital for anyone managing debt or analyzing macroeconomic trends.
Conclusion
The percentage change between two numbers is far more than a simple arithmetic exercise; it is the fundamental metric of the financial world. It provides the context necessary to evaluate investment returns, the benchmarks required to measure corporate success, and the clarity needed to manage personal wealth.
By mastering this concept, you move beyond seeing money as a static pile of currency and begin seeing it as a dynamic, flowing force. Whether you are calculating the ROI of a new stock pick, analyzing the YoY growth of your business, or protecting your purchasing power from inflation, the percentage change is your most reliable compass. In the pursuit of financial mastery, it isn’t just about the numbers you have—it’s about the percentage by which you can make them grow.
aViewFromTheCave is a participant in the Amazon Services LLC Associates Program, an affiliate advertising program designed to provide a means for sites to earn advertising fees by advertising and linking to Amazon.com. Amazon, the Amazon logo, AmazonSupply, and the AmazonSupply logo are trademarks of Amazon.com, Inc. or its affiliates. As an Amazon Associate we earn affiliate commissions from qualifying purchases.