In the world of finance, numbers are the language of progress. Whether you are tracking the growth of a retirement account, evaluating the success of a side hustle, or analyzing the quarterly revenue of a Fortune 500 company, the ability to quantify change is essential. While raw numbers provide a snapshot, they rarely tell the whole story. To understand the velocity and scale of financial movement, we turn to the “percent increase.”
Finding the percent increase between two numbers is one of the most fundamental skills in money management. It transforms abstract figures into actionable insights, allowing investors and business owners to compare performance across different scales and timeframes. In this comprehensive guide, we will explore the mathematical formula behind percent increase and dive deep into its practical applications across personal finance, investing, and corporate strategy.

Understanding the Core Formula: The Mathematical Engine of Finance
At its heart, the calculation of percent increase is a measure of relative change. It tells you how much a value has grown in relation to its starting point. Without this context, financial data can be misleading. For instance, a $1,000 gain on a $2,000 investment is extraordinary, while a $1,000 gain on a $1,000,000 portfolio is merely a rounding error.
Defining the Variables
To calculate the percent increase, you only need two pieces of data:
- The Initial Value (V1): This is the starting point, often referred to as the “old” or “original” value.
- The Final Value (V2): This is the ending point, or the “new” value.
In financial terms, V1 might be the price you paid for a stock, while V2 is its current market price.
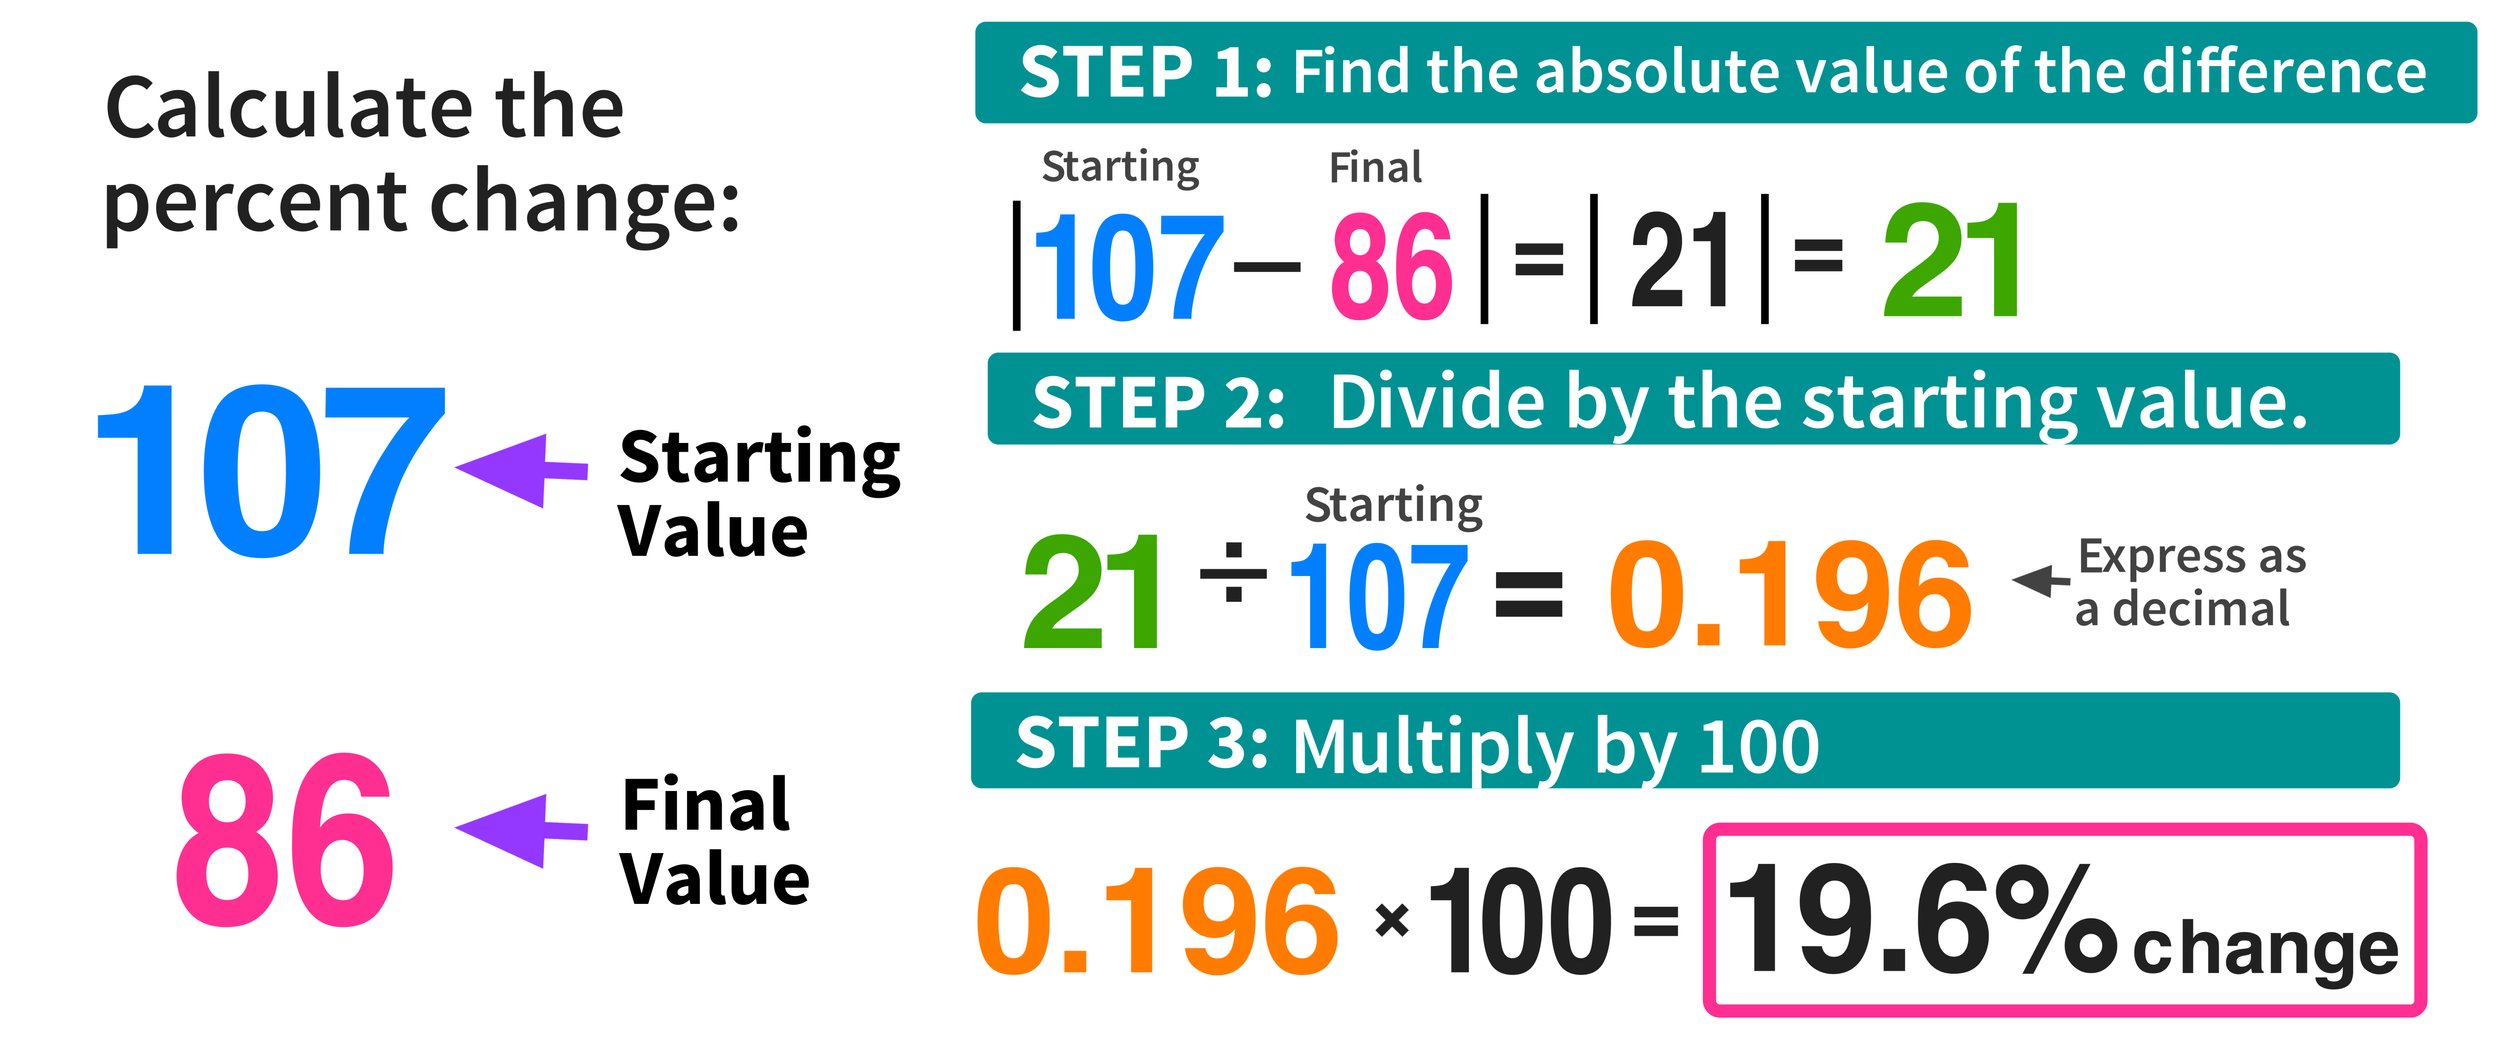
The Step-by-Step Calculation Process
The formula for finding the percent increase is straightforward:
[(New Value – Original Value) / Original Value] × 100
To arrive at the final percentage, follow these three steps:
- Step 1: Find the absolute difference. Subtract the original value from the new value ($V2 – V1$). This gives you the total amount of growth.
- Step 2: Divide by the original value. Take the result from Step 1 and divide it by the original value ($V1$). This converts the growth into a decimal relative to the starting point.
- Step 3: Convert to a percentage. Multiply the decimal by 100 to get the percent increase.
Why the Denominator Matters Most
The most common mistake in financial analysis is dividing by the new value instead of the original value. In the world of money, the denominator (the original value) represents your “cost basis” or your initial stake. By dividing the growth by the original value, you are measuring the efficiency of your capital. A smaller denominator makes a specific numerical gain much more significant in percentage terms, which is why early-stage investing can offer such explosive percentage returns compared to established blue-chip stocks.
The Role of Percent Increase in Personal Wealth Management
For the individual saver or earner, understanding percent increase is vital for maintaining purchasing power and ensuring that one’s financial trajectory is heading in the right direction.
Tracking Inflation and Purchasing Power
Inflation is essentially the percent increase in the cost of goods and services over time. If the Consumer Price Index (CPI) shows a 5% increase year-over-year, it means your money has lost 5% of its value. By calculating the percent increase in your own monthly expenses, you can determine if your lifestyle is becoming more expensive and whether your income is keeping pace. If your rent increases from $1,500 to $1,650, using the formula $(1650 – 1500) / 1500$ reveals a 10% increase—a figure that may prompt you to renegotiate your lease or adjust your budget elsewhere.
Evaluating Salary Increases and Career Trajectory
When negotiating a raise or considering a new job offer, the raw dollar amount is often less important than the percent increase. A $5,000 raise means something very different to someone earning $50,000 (a 10% increase) than it does to someone earning $200,000 (a 2.5% increase). In the context of “Money,” your human capital is your greatest asset. Tracking the percentage growth of your annual income helps you benchmark your career progress against industry standards and inflation.
Monitoring Lifestyle Creep and Expense Growth
“Lifestyle creep” occurs when an increase in income leads to a proportional (or greater) increase in spending. By calculating the percent increase in your discretionary spending alongside the percent increase in your net income, you can maintain financial discipline. If your income increases by 10% but your spending increases by 15%, your “wealth gap” is shrinking despite your higher earnings.
Measuring Investment Performance and Portfolio Volatility
In the realm of investing, percent increase is the universal metric for success. It allows for a “level playing field” when comparing different asset classes, such as real estate, stocks, and cryptocurrencies.
Realized vs. Unrealized Capital Gains
When you check your brokerage account, you see “unrealized gains”—the percent increase in the value of your holdings since you purchased them. If you bought a share of an Index Fund at $300 and it is now trading at $450, you have experienced a 50% increase. Calculating this percentage helps you decide when to rebalance your portfolio. If one asset has a massive percent increase relative to others, it may now represent an oversized portion of your risk profile.
The Power of Compound Growth Metrics
While simple percent increase measures change between two points, it serves as the foundation for the Compound Annual Growth Rate (CAGR). Investors use CAGR to understand the smoothed annual percent increase over a period of years. This is essential for long-term retirement planning. Understanding that a portfolio needs a 7% average annual percent increase to double every ten years (the Rule of 72) allows for more strategic asset allocation.
Analyzing Dividend Growth Rates
For income investors, the percent increase in dividend payments is often more important than the stock price itself. A company that increases its dividend from $1.00 per share to $1.10 per share has provided a 10% dividend growth rate. Consistently high percentage increases in dividends are a hallmark of “Dividend Aristocrats” and indicate a healthy, cash-flow-positive business.
Business Finance: Scaling and Key Performance Indicators (KPIs)
For entrepreneurs and corporate executives, percent increase is the primary tool for measuring the health and scalability of a business venture.
Year-over-Year (YoY) and Month-over-Month (MoM) Growth
In business finance, looking at raw revenue can be deceptive due to seasonality. Instead, analysts look at Year-over-Year (YoY) percent increases. For example, comparing December revenue of the current year to December revenue of the previous year accounts for the holiday shopping surge. A 20% YoY increase suggests the business is expanding its market share, whereas a flat or negative percentage indicates stagnation or a need for a pivot in strategy.
Profit Margin Expansion
Percent increase isn’t just for top-line revenue; it is also used to track efficiency. If a company’s revenue increases by 10% but its net profit increases by 20%, the company is experiencing “operating leverage.” This means they are managing costs effectively and making more money on every dollar of sales. Tracking the percent increase in profit margins is a key indicator of a company’s competitive moat and long-term viability.
Market Share and Customer Acquisition Trends
For startups, the percent increase in the user base or customer count is a vital metric for attracting venture capital. High “double-digit” month-over-month growth is often the benchmark for a successful tech or fintech product. By calculating the percent increase in Customer Acquisition Cost (CAC) versus the percent increase in Customer Lifetime Value (LTV), a business can determine if its growth is sustainable or if it is “burning” too much cash to acquire users.
Advanced Considerations: Avoiding Misleading Financial Data
While the percent increase formula is a powerful tool, it can be manipulated or misinterpreted if not viewed with a critical eye.
The “Base Effect” Trap
The “Base Effect” refers to how the starting point (V1) can skew the perception of growth. If a penny stock goes from $0.01 to $0.02, it has experienced a 100% increase. While this sounds impressive, the actual dollar gain is negligible. Conversely, if a massive corporation like Amazon grows its revenue by 5%, the dollar amount added to the economy is billions. When evaluating financial news, always look at the base number to ensure the percentage change is meaningful.
Percentage Points vs. Percent Change
In the context of interest rates or profit margins, people often confuse “percent increase” with “percentage points.” If an interest rate moves from 3% to 4%, it has increased by one percentage point. However, the percent increase in the interest rate is actually 33.3% ($(4 – 3) / 3$). In finance, this distinction is critical, especially when discussing mortgage rates, bond yields, or tax brackets.
Real Growth vs. Nominal Growth
Finally, savvy financial minds always distinguish between nominal percent increase and real percent increase. Nominal growth is the raw percentage calculated using the formula. Real growth is that percentage minus the rate of inflation. If your investment portfolio grew by 8% last year, but inflation was 9%, your “real” percent increase was actually -1%. You have more dollars, but those dollars can buy fewer goods.
By mastering the calculation of percent increase and understanding its nuances within the niche of money and finance, you gain a significant advantage. You move beyond seeing numbers as static facts and begin to see them as dynamic indicators of momentum, risk, and opportunity. Whether you are managing a household budget or a multi-million dollar fund, the percent increase remains your most reliable compass for navigating the complexities of the financial world.
aViewFromTheCave is a participant in the Amazon Services LLC Associates Program, an affiliate advertising program designed to provide a means for sites to earn advertising fees by advertising and linking to Amazon.com. Amazon, the Amazon logo, AmazonSupply, and the AmazonSupply logo are trademarks of Amazon.com, Inc. or its affiliates. As an Amazon Associate we earn affiliate commissions from qualifying purchases.