
In the world of investing, there is perhaps no question more frequent or more anxiety-inducing during a downturn than, “How low can the stock market go?” Whether fueled by a sudden geopolitical crisis, a shift in monetary policy, or a looming recession, market corrections and bear markets are an inevitable part of the financial lifecycle. However, for the individual investor, seeing a portfolio dip into the red can trigger a primitive “fight or flight” response.
Understanding the floor of a market requires a blend of historical context, mathematical valuation, and an appreciation for human psychology. While no one possesses a crystal ball, the “bottom” is rarely a random number. It is usually the point where valuation meets exhaustion. This article explores the mechanics behind market declines, the indicators that signal a potential floor, and the strategies investors can use to navigate periods of extreme volatility.
The Fundamentals of Market Valuations: Finding the “Fair” Floor
To understand how low a market can go, one must first understand what the market is actually worth. Prices fluctuate daily based on sentiment, but over the long term, stock prices are driven by corporate earnings and the value of those earnings in today’s dollars.
Valuation Metrics: P/E Ratios and the Shiller CAPE
The most common lens through which investors view market value is the Price-to-Earnings (P/E) ratio. When the market is “expensive,” P/E ratios are high relative to historical averages. During a crash, the market often doesn’t just return to the average; it frequently “overshoots” to the downside.
A more robust metric is the Shiller P/E ratio, or the Cyclically Adjusted Price-to-Earnings (CAPE) ratio. This measures price against the average of ten years of earnings, adjusted for inflation. Historically, when the Shiller P/E reaches extreme heights (as seen in 1929 or 2000), the potential for a significant “low” increases. To find the bottom, analysts look for the market to retract toward its long-term mean—often suggesting that a market can fall until it reaches a P/E that reflects a “bargain” rather than “fair value.”
The Role of Corporate Earnings and Guidance
Stock prices are essentially a claim on future profits. If a recession is looming, analysts begin to slash their earnings-per-share (EPS) estimates for S&P 500 companies. The “floor” of the market moves downward as these estimates drop. If companies collectively signal that profits will decline by 10%, the market might fall by 15% to 20% to account for both the lower earnings and the increased risk. The market finds its low when the “bad news” is fully priced in—meaning the actual earnings reports are no longer worse than what investors expected.
Mean Reversion and Historical Drawdowns
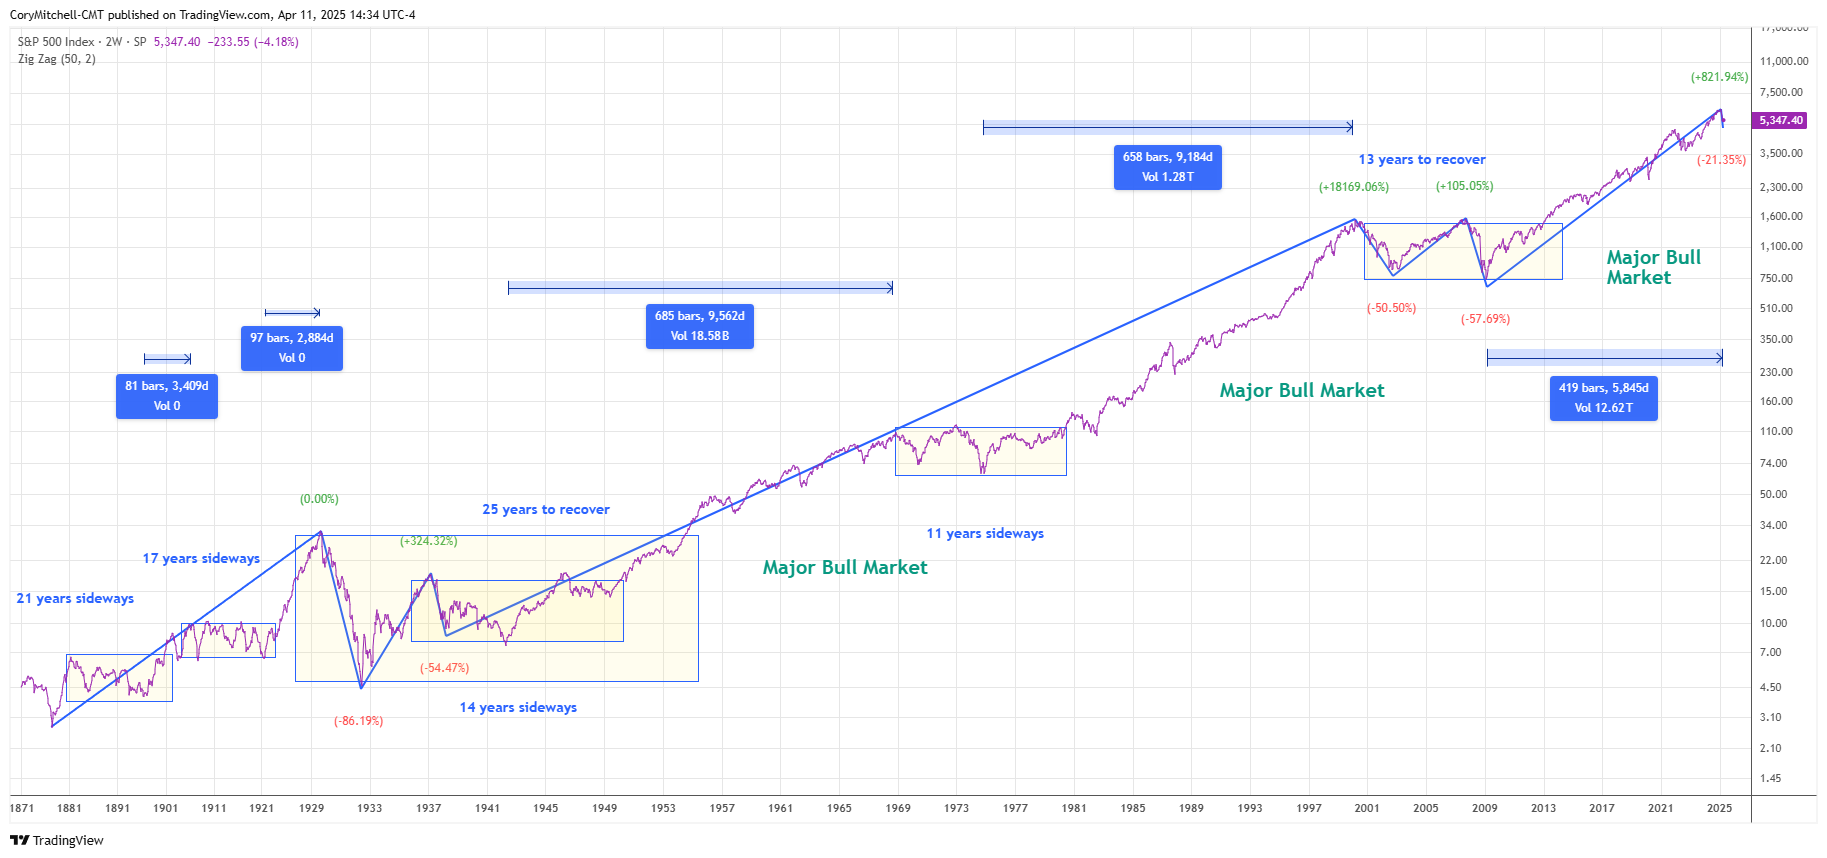
History provides a roadmap, though not a perfect one. Since World War II, the average bear market (a decline of 20% or more) has seen a peak-to-trough drop of roughly 30% to 35%. In extreme cases, such as the 2008 Financial Crisis or the Great Depression, the drops were much deeper (50% to 80%). By studying these historical precedents, investors can contextualize current losses. If the market is down 15%, history suggests there could be more room to fall; if it is down 35%, we are likely closer to a bottom than a top.
Macroeconomic Catalysts: Why Markets Bottom Out
The stock market does not exist in a vacuum. It is heavily influenced by the broader economy, specifically interest rates and the actions of central banks like the Federal Reserve.
The Impact of Interest Rates and the “Risk-Free” Rate
One of the most significant factors in determining how low a market can go is the “risk-free rate of return,” typically represented by U.S. Treasury yields. When interest rates rise, the present value of future corporate cash flows decreases. Furthermore, if an investor can get a guaranteed 5% return from a government bond, they are less likely to risk their capital in the stock market unless stocks are priced cheaply enough to offer a significantly higher expected return. Therefore, in a rising-rate environment, the “bottom” for stocks is often much lower than in a low-rate environment.
Inflation and Purchasing Power
Inflation acts as a double-edged sword. Initially, it can hurt stocks as it raises input costs for companies and reduces consumer spending. However, stocks are also “real assets”—companies can eventually raise prices to match inflation. The market often finds its low point when inflation shows signs of peaking. Once the market perceives that the “worst” of the inflationary pressure is over, investors begin to look past the current pain toward a recovery, often causing the market to bottom out months before the economy actually improves.
Liquidity and Credit Spreads
A market can go significantly lower if there is a “liquidity crunch.” This happens when investors are forced to sell assets to cover debts or margin calls. We monitor credit spreads—the difference in interest rates between “safe” government bonds and “risky” corporate bonds. If credit spreads widen drastically, it indicates a lack of trust in the financial system. The market usually reaches its absolute low when the central bank steps in to provide liquidity, effectively putting a “floor” under the financial system.
The Psychology of the Bottom: Fear, Capitulation, and Sentiment
The math of valuations only tells half the story. The other half is dictated by human emotion. Markets often fall further than “fair value” because of fear.
The Concept of Capitulation
“Capitulation” is the moment when the last remaining bulls give up and sell their positions. It is characterized by high trading volume and a “sell-at-any-price” mentality. Ironically, this moment of maximum pessimism is often the market bottom. When everyone who wants to sell has already sold, the only direction left for the market to go is up. Indicators like the VIX (Volatility Index), often called the “Fear Gauge,” help identify these moments. A very high VIX (typically above 30 or 40) often correlates with a market that is nearing its lowest point.
Contrarian Indicators and Retail Sentiment
Professional investors often look at retail sentiment as a contrarian indicator. When surveys (like the AAII Sentiment Survey) show that the vast majority of individual investors are “bearish,” it often signals that the market is oversold. How low the market can go is frequently determined by how much “pain” the average investor can tolerate. Once the general public is convinced that the market will never recover, the bottom is usually very close.
The Role of Algorithmic Trading and Margin Calls
In the modern era, “how low” is also influenced by machines. Many hedge funds and institutional investors use algorithmic triggers. If the market hits a certain technical level (like the 200-day moving average), it can trigger a wave of automated selling. Additionally, as prices drop, investors who borrowed money to buy stocks (margin) are forced to sell by their brokers. This creates a “forced selling” loop that can drive prices to irrational lows before the market finally stabilizes.
Strategic Responses: How to Invest When the Floor is Uncertain
For the individual investor, the goal shouldn’t necessarily be to predict the exact bottom, but rather to survive the journey there and position themselves for the eventual recovery.
Dollar-Cost Averaging (DCA) in Volatile Markets
Since it is impossible to know exactly how low the market will go, the most effective strategy is often Dollar-Cost Averaging. By investing a fixed amount of money at regular intervals, you buy more shares when prices are low and fewer shares when prices are high. This removes the emotional burden of trying to “time” the bottom and ensures that you are accumulating assets during the periods of maximum discount.
Identifying Defensive Sectors and Safe Havens
During a race to the bottom, not all stocks fall equally. Defensive sectors—such as Healthcare, Utilities, and Consumer Staples—tend to hold their value better because people still need to buy medicine, pay for electricity, and eat, regardless of the economy. Investors concerned about how low the market can go often rotate their portfolios into these “safe havens” to mitigate losses while maintaining market exposure.
The Importance of a Cash Reserve
The best way to handle a falling market is to have the “dry powder” (cash) available to take advantage of low prices. Having a robust emergency fund ensures you aren’t forced to sell your investments at the bottom to cover living expenses. Furthermore, having extra cash allows you to view a market crash as a “sale” rather than a disaster. The market’s low point is only a tragedy if you are forced to sell; it is an opportunity if you are able to buy.
Conclusion: The Resilience of the Market Floor
While the question “how low can the stock market go?” is terrifying in the heat of a sell-off, history shows that the market has a 100% success rate of recovering from its lows and reaching new highs. The “low” is not a permanent state; it is a temporary recalibration of price, value, and sentiment.
By focusing on valuations, understanding macroeconomic triggers, and managing the psychological urge to panic, investors can see market downturns for what they truly are: a transfer of assets from the impatient to the patient. The floor of the market is rarely found by looking at a chart, but rather by looking at the fundamentals of the companies within it and having the discipline to stay the course when the headlines are at their darkest. In the end, the market goes only as low as the point where the collective fear of losing money is finally outweighed by the collective fear of missing out on the eventual recovery.
aViewFromTheCave is a participant in the Amazon Services LLC Associates Program, an affiliate advertising program designed to provide a means for sites to earn advertising fees by advertising and linking to Amazon.com. Amazon, the Amazon logo, AmazonSupply, and the AmazonSupply logo are trademarks of Amazon.com, Inc. or its affiliates. As an Amazon Associate we earn affiliate commissions from qualifying purchases.