In the dynamic world of finance, few indicators command as much attention and generate as many headlines as the Dow Jones Industrial Average (DJIA). Often simply referred to as “the Dow,” this iconic index serves as a daily barometer of the U.S. stock market’s health and, by extension, the broader economy. When investors, journalists, and everyday citizens ask, “What is the Dow Jones doing?”, they are not just seeking a single number; they are looking for insights into market sentiment, economic trends, and the potential implications for their own financial well-being. Understanding the Dow’s movements, its underlying drivers, and its significance is crucial for anyone navigating the complex landscape of investing and personal finance.

The Dow Jones Industrial Average represents a slice of America’s industrial might and innovation, tracking 30 prominent, publicly traded companies. Its fluctuations are a constant topic of discussion, influencing everything from investment strategies to consumer confidence. While it’s just one of many market indices, its historical prominence and straightforward nature make it a widely accessible proxy for the market’s pulse. Delving into “what the Dow is doing” requires moving beyond the daily percentage change and exploring the intricate web of economic, corporate, and global factors that orchestrate its performance.
Understanding the Dow Jones Industrial Average (DJIA): More Than Just a Number
To truly grasp what the Dow is doing at any given moment, one must first understand what it is and how it functions. The DJIA is not merely a random collection of stocks; it’s a carefully curated selection designed to reflect significant sectors of the American economy. Its history is intertwined with the very development of modern financial markets, providing a continuous narrative of economic cycles, technological shifts, and corporate evolution.
A Legacy of American Industry: Origin and Purpose
The Dow Jones Industrial Average was created by Charles Dow, co-founder of Dow Jones & Company, and editor of The Wall Street Journal, in 1896. Initially comprising just 12 industrial companies, it was designed to provide a clear and concise snapshot of the health of the American industrial sector. In an era before sophisticated economic models, the Dow offered an accessible way for the public to gauge the performance of the nation’s leading businesses. Over a century later, while the composition has evolved dramatically to include technology, finance, and consumer goods companies, its core purpose remains the same: to act as a bellwether for the U.S. stock market and, by extension, the broader economy. It embodies a historical perspective, reflecting the long-term growth and resilience of American enterprise through various booms, busts, wars, and technological revolutions. This historical context provides a crucial framework for interpreting its current activities.
The “Blue-Chip” Benchmark: Composition and Selection
Today, the DJIA comprises 30 of the largest and most influential publicly traded companies in the United States. These are often referred to as “blue-chip” stocks, signifying their long-standing reputation, financial stability, and leadership within their respective industries. Unlike other indices such as the S&P 500, which follows strict rules for inclusion based on market capitalization, the selection of companies for the Dow is determined by the editors of The Wall Street Journal. Their primary criterion is to ensure the index accurately represents a broad cross-section of major U.S. industries. This discretionary approach allows for flexibility, ensuring the Dow remains relevant as economic landscapes shift. Companies like Apple, Microsoft, Johnson & Johnson, Walmart, and Coca-Cola are mainstays, illustrating the diverse sectors – from technology and healthcare to retail and consumer staples – that contribute to the nation’s economic output. When one asks what the Dow is doing, they are, in essence, asking about the collective performance of these economic titans.
Price-Weighted Peculiarities: How the DJIA is Calculated
Perhaps one of the most distinctive and often misunderstood aspects of the DJIA is its calculation methodology: it is a price-weighted index. This means that stocks with higher share prices have a greater impact on the index’s value than stocks with lower share prices, regardless of the company’s total market capitalization. To illustrate, if a company trading at $300 a share moves up by $1, its impact on the Dow is significantly larger than a company trading at $50 a share moving up by $1, even if the latter company has a larger market value. This contrasts sharply with market-capitalization-weighted indices like the S&P 500, where a company’s influence is proportional to its market value. The DJIA employs a “Dow Divisor,” a number that adjusts for stock splits, dividends, and changes in the index’s composition, ensuring historical continuity. While this price-weighted approach has its critics, it contributes to the Dow’s unique character and explains why certain high-priced stocks can disproportionately sway its daily movements, making “what the Dow is doing” a nuanced inquiry.
Current Snapshot: Analyzing Recent Dow Jones Movements
When investors inquire about the Dow’s current activity, they are typically looking for more than just the latest closing price. They seek context: whether the market is trending up or down, the degree of volatility, and which sectors or specific companies are driving these changes. A detailed analysis of its recent performance provides crucial insights into the immediate health and sentiment of the U.S. stock market.
Recent Volatility and Key Performance Indicators
The Dow, like all major indices, experiences periods of heightened volatility and sustained trends. In recent times, for example, the Dow’s movements have often reflected a tug-of-war between optimism regarding economic growth and concerns over inflation, interest rate hikes, and geopolitical instability. Key performance indicators (KPIs) for the Dow involve looking at its daily, weekly, and monthly percentage changes, as well as tracking its movement relative to significant technical levels, such as its 50-day or 200-day moving averages. A strong upward trend, breaking through resistance levels, often signals bullish sentiment, driven by robust corporate earnings or positive economic data. Conversely, sharp declines or sustained downtrends, especially if coupled with increasing trading volume, can indicate growing investor apprehension, often triggered by recession fears, rising energy prices, or unexpected policy shifts. Monitoring these KPIs helps paint a comprehensive picture of the Dow’s immediate trajectory.
Sectoral Contributions: Which Companies Are Leading/Lagging?
Given that the Dow is composed of 30 diverse companies, its overall performance is a composite of their individual fortunes. A critical part of understanding what the Dow is doing involves identifying which sectors or specific “blue-chip” companies are contributing most to its gains or losses. For instance, if technology giants like Apple and Microsoft are performing strongly, they can lift the entire index significantly due to their high share prices. Conversely, if industrial stalwarts like Boeing or financial institutions like Goldman Sachs face headwinds, their struggles can drag the Dow down. Analyzing this sectoral contribution helps diagnose the underlying drivers of market movements. Are consumers spending more, boosting retail and consumer discretionary stocks? Is innovation in healthcare or technology propelling growth? Or are traditional industries facing pressures? This granular analysis provides a deeper understanding of economic activity and market leadership, moving beyond the headline index number to reveal the sectors flourishing or faltering.
Short-Term Swings vs. Long-Term Trajectories
It’s crucial for investors to differentiate between short-term market noise and long-term trends when observing the Dow. Daily or even weekly fluctuations, while attention-grabbing, can often be attributed to transient factors like news events, analyst upgrades/downgrades, or intraday trading patterns. These short-term swings, while impactful for day traders, rarely dictate the long-term investment narrative. A more insightful approach involves stepping back to observe the Dow’s performance over months or years. Historically, despite numerous corrections and bear markets, the Dow has demonstrated a remarkable long-term upward trajectory, reflecting the underlying growth of the U.S. economy and corporate profitability. Understanding this distinction helps investors avoid panic selling during brief downturns and stay focused on their long-term financial goals. While daily movements answer “what is the Dow doing today?”, the long-term trajectory answers “what is the Dow doing for my future?”
The Forces at Play: Drivers Behind Dow’s Performance
The Dow Jones Industrial Average does not move in a vacuum. Its daily oscillations and long-term trends are the culmination of a complex interplay of macroeconomic forces, corporate performance, government policies, and global events. Unpacking these drivers is essential for any investor seeking to understand market dynamics and make informed decisions.
Macroeconomic Indicators: Inflation, GDP, and Employment
At the heart of the Dow’s movements are fundamental macroeconomic indicators. Inflation, as measured by the Consumer Price Index (CPI) or Producer Price Index (PPI), significantly impacts corporate profitability and consumer spending. High inflation often leads to tighter monetary policy, which can dampen economic growth and corporate earnings, putting downward pressure on the Dow. Conversely, contained inflation allows for more stable economic expansion. Gross Domestic Product (GDP) reports, which measure the total output of goods and services, offer a direct snapshot of economic health. Strong GDP growth usually correlates with robust corporate revenues and higher stock prices. Employment figures, particularly the non-farm payrolls and unemployment rate, reflect consumer confidence and purchasing power. A strong job market signals a healthy economy, supporting the Dow, while rising unemployment can signal an impending slowdown. Each of these indicators, when released, can cause immediate and significant shifts in the Dow, as investors recalibrate their expectations for future earnings and economic stability.
Corporate Earnings and Guidance: The Bottom Line Impact
Ultimately, the value of a stock, and by extension a stock index, is tied to the underlying profitability of its constituent companies. Corporate earnings reports, released quarterly, are pivotal drivers of the Dow’s performance. When the 30 companies in the Dow report stronger-than-expected earnings, it often signals healthy business operations, efficient management, and robust consumer demand, typically propelling the index higher. Equally important is the “guidance” provided by company management regarding future earnings expectations. Even if current earnings are strong, a cautious outlook for the coming quarters can lead to a sell-off, as investors price in future challenges. Conversely, optimistic guidance, even with a mixed current quarter, can instill confidence. Analysts constantly adjust their models based on these reports, and the aggregate sentiment towards future corporate profitability heavily influences the Dow’s trajectory. A period of widespread earnings beats across Dow components often translates into a bullish market, while a string of disappointments can trigger a downturn.
Federal Reserve Policy: Interest Rates and Quantitative Easing
The Federal Reserve, as the U.S. central bank, wields immense influence over the economy and, consequently, the stock market. Its monetary policy decisions, particularly regarding interest rates and quantitative easing (or tightening), are closely watched by investors. When the Fed raises interest rates, borrowing becomes more expensive for businesses and consumers, which can slow economic growth, reduce corporate profits, and make bonds more attractive relative to stocks. This typically puts downward pressure on the Dow. Conversely, lowering interest rates or engaging in quantitative easing (injecting liquidity into the financial system) tends to stimulate economic activity and boost stock valuations. The market’s interpretation of the Fed’s stance – whether it’s hawkish (leaning towards higher rates) or dovish (leaning towards lower rates) – can cause significant daily and weekly shifts in the Dow. Speeches by the Fed Chair, minutes from Federal Open Market Committee (FOMC) meetings, and inflation targeting policies all play a critical role in shaping investor expectations and, therefore, the Dow’s performance.
Geopolitical Events and Global Shocks: Unpredictable Influences
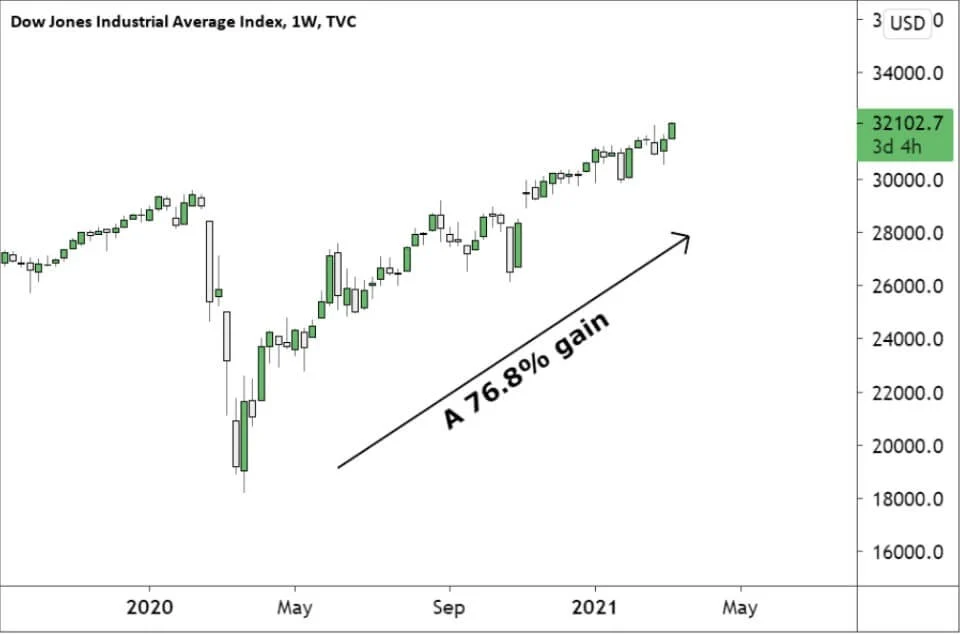
Beyond the economic fundamentals and corporate specifics, the Dow is also susceptible to unpredictable geopolitical events and global shocks. Major international conflicts, trade wars, pandemics, terrorist attacks, or natural disasters can introduce significant uncertainty into global markets, prompting investors to seek safe-haven assets and leading to sell-offs in equities. For instance, the COVID-19 pandemic triggered a historic downturn in early 2020, even as the underlying economic fundamentals were strong just weeks prior. Similarly, escalating tensions between major global powers or disruptions to critical supply chains can create immediate market volatility. These events introduce an element of unpredictability that even the most sophisticated financial models struggle to account for, underscoring the interconnectedness of global affairs and financial markets. While these shocks are often temporary, their initial impact on the Dow can be severe, reflecting the immediate re-evaluation of risk by the investment community.
Beyond the Index: What Dow Jones Trends Mean for You
Understanding the Dow’s daily fluctuations and long-term trends extends beyond academic interest for most individuals. The index’s movements can have tangible implications for personal financial planning, investment strategies, and even psychological well-being. Recognizing these connections helps in translating market headlines into actionable financial insights.
Investor Sentiment and Market Psychology
The Dow is not just a collection of company values; it’s a reflection of collective human psychology – fear and greed. A rising Dow often correlates with increasing investor confidence, encouraging more people to invest and spend, creating a positive feedback loop. This “bullish” sentiment can lead to herd behavior, where individuals fear missing out on gains and jump into the market. Conversely, a falling Dow can trigger widespread fear, prompting sell-offs and leading to a “bearish” sentiment that can cascade into broader economic concerns. Understanding that market movements are partly driven by psychology helps investors avoid irrational decisions. When the Dow is doing particularly well, it might be a time to temper euphoria and review risk. When it’s falling sharply, it might be a moment to resist panic and remember long-term goals. The Dow acts as a powerful psychological barometer, influencing how individuals perceive their financial future and thus impacting their spending and saving habits.
Economic Bellwether: Signalling Broader Economic Health
While not a perfect predictor, the Dow is widely considered a leading economic indicator. Its performance often anticipates broader economic trends by several months. A sustained uptrend in the Dow can signal an impending period of economic expansion, as investors bet on future growth and corporate profitability. Conversely, a prolonged decline can suggest an upcoming economic slowdown or recession. This “bellwether” function stems from the fact that stock prices reflect future earnings expectations. If investors collectively foresee challenges ahead, they will discount future earnings, causing stock prices to fall. Therefore, when the Dow is “doing well,” it implies a generally optimistic outlook for jobs, consumer spending, and business investment. When it’s “doing poorly,” it signals caution. For individuals, this means paying attention to the Dow can offer clues about the overall economic environment, informing decisions related to job security, consumer debt, and major purchases.
Diversification and Portfolio Strategy
For individual investors, the Dow’s performance, while indicative of broad market health, should not be the sole determinant of their investment strategy. A diversified portfolio, spread across various asset classes (stocks, bonds, real estate, etc.) and different market segments, is crucial for mitigating risk. While the Dow represents 30 blue-chip companies, it doesn’t encompass the entire market. Relying solely on the Dow’s movements might lead to an overconcentration in large-cap U.S. industrial stocks. Understanding what the Dow is doing allows investors to gauge overall market momentum, but it should be viewed within the context of a well-diversified strategy that aligns with their personal risk tolerance and financial goals. A diversified approach ensures that a downturn in the specific sectors represented by the Dow does not decimate one’s entire portfolio, providing resilience against market volatility.
Navigating Market Volatility: Strategies for Investors
The question “what is the Dow Jones doing?” is often accompanied by an underlying anxiety, especially during periods of volatility. For investors, understanding the Dow’s movements is not enough; it requires developing strategies to navigate these fluctuations effectively and align them with their personal financial objectives.
Long-Term Perspective: Avoiding Panic Reactions
One of the most critical strategies for dealing with Dow volatility is to adopt a long-term perspective. While daily swings can be unsettling, historical data unequivocally shows that markets, including the Dow, tend to recover from downturns and achieve new highs over extended periods. Panic selling during a sharp decline means locking in losses and missing out on the subsequent rebound. For investors with a time horizon of several years or decades, short-term market corrections are often opportunities to buy quality assets at lower prices. Rather than reacting impulsively to headlines about the Dow’s latest plunge, a disciplined approach involves sticking to a predetermined investment plan, understanding that market downturns are a normal, albeit uncomfortable, part of the investment cycle. The focus should be on compounding returns over time, not on outsmarting daily market movements.
Rebalancing and Risk Management
Regular portfolio rebalancing is another key strategy. As the Dow and the broader market fluctuate, the asset allocation of a portfolio can drift away from its target. For instance, if stocks have performed exceptionally well, the equity portion of a portfolio might become disproportionately large, increasing overall risk. Rebalancing involves periodically selling assets that have grown (e.g., some of your Dow-related stocks or funds) and buying assets that have lagged, bringing the portfolio back to its desired risk profile. This systematic approach helps manage risk, forces investors to “buy low and sell high” (in a disciplined manner), and ensures the portfolio remains aligned with one’s financial goals and risk tolerance. Risk management also involves understanding the overall exposure to market-sensitive assets and ensuring that one’s emergency fund is robust enough to cover several months of expenses, preventing the forced sale of investments during downturns.
The Role of Professional Advice
For many, interpreting the Dow’s movements and crafting an effective investment strategy can be overwhelming. This is where professional financial advisors play a crucial role. A qualified advisor can help individuals understand their risk tolerance, define clear financial goals, and construct a diversified portfolio that is resilient to market fluctuations. They can provide unbiased guidance during periods of market volatility, helping clients avoid emotionally driven decisions. An advisor can also help contextualize what the Dow is doing, explaining how its movements fit into the broader economic landscape and their specific financial plan. While the Dow provides a snapshot, a financial advisor offers a personalized roadmap, ensuring that market events are integrated into a comprehensive and disciplined investment strategy, ultimately fostering greater financial security and peace of mind.
The daily performance of the Dow Jones Industrial Average is a constant topic of conversation in financial circles, serving as both a source of anxiety and a beacon of opportunity. By understanding its composition, the forces that drive its movements, and its broader implications, investors can move beyond simply asking “what is the Dow Jones doing?” to glean meaningful insights that inform their long-term financial journey.
aViewFromTheCave is a participant in the Amazon Services LLC Associates Program, an affiliate advertising program designed to provide a means for sites to earn advertising fees by advertising and linking to Amazon.com. Amazon, the Amazon logo, AmazonSupply, and the AmazonSupply logo are trademarks of Amazon.com, Inc. or its affiliates. As an Amazon Associate we earn affiliate commissions from qualifying purchases.