
The question “How did the markets do today?” is perhaps the most frequently asked inquiry in the world of finance. To the casual observer, it might simply be a request for a green or red percentage on a screen. However, to the seasoned investor, business owner, or financial professional, the answer reveals a complex tapestry of economic data, psychological shifts, and global geopolitical movements. Understanding daily market performance requires looking beyond the closing numbers of the major indices and peering into the underlying sectors, fixed-income movements, and the macroeconomic catalysts that drive capital.
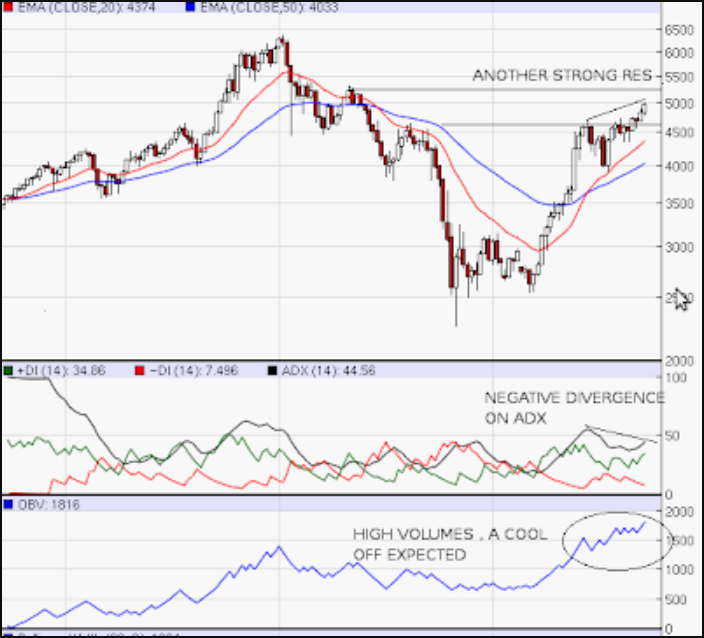
In this analysis, we will deconstruct the components of market performance, exploring why certain indices move in tandem while others diverge, and how investors can interpret daily volatility to make informed long-term financial decisions.
Decoding the Major Indices: The Benchmarks of Performance
When we talk about “the market,” we are usually referring to a handful of major indices that serve as proxies for the broader economy. Each index tells a different story about the health of specific industries and the sentiment of different types of investors.
The S&P 500: The Broader Market Indicator
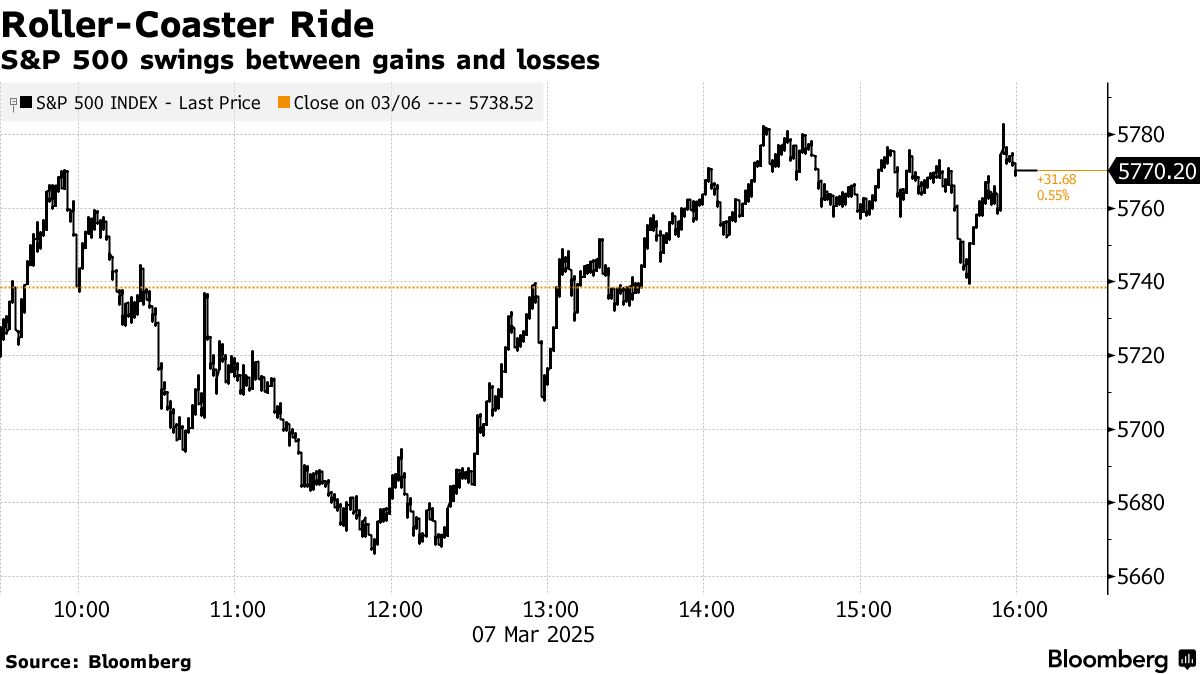
The Standard & Poor’s 500 is widely considered the best single gauge of large-cap U.S. equities. Because it is market-capitalization-weighted, the performance of the S&P 500 is heavily influenced by the largest companies in the world. When the S&P 500 is up, it generally indicates that institutional investors are confident in the earnings potential of corporate America. On a typical trading day, movements in this index reflect a broad consensus on the current economic environment, including corporate health and consumer spending.
The Dow Jones Industrial Average: The Blue-Chip Pulse
The Dow is a price-weighted index of 30 significant stocks traded on the New York Stock Exchange and the Nasdaq. Because it only includes 30 “blue-chip” companies, it is often seen as a measure of the “old economy”—established giants in industrials, healthcare, and finance. While it is less diversified than the S&P 500, a strong performance in the Dow often signals that investors are seeking stability and dividends rather than high-risk growth.
The Nasdaq Composite: The Growth and Tech Barometer
The Nasdaq is heavily weighted toward the technology, biotechnology, and growth sectors. If the Nasdaq outperforms the Dow on a given day, it usually indicates a “risk-on” sentiment, where investors are willing to pay a premium for future earnings potential. Conversely, when the Nasdaq lags, it often suggests that rising interest rates or overvaluation concerns are pushing investors toward more defensive assets.
Macroeconomic Catalysts Driving Daily Fluctuations
The markets do not move in a vacuum. Every price tick is a reaction to incoming data. To understand why the markets performed a certain way today, one must look at the primary drivers: the Federal Reserve, inflation, and global events.
Interest Rates and Federal Reserve Policy
The Federal Reserve (the “Fed”) is the most powerful force in the financial markets. Investors hang on every word of the Fed Chair, looking for clues regarding interest rate hikes or cuts. Higher interest rates make borrowing more expensive for companies and consumers, which can slow down economic growth and lower stock valuations. On days when the Fed adopts a “hawkish” tone (indicating a preference for higher rates to fight inflation), the markets often react negatively. On “dovish” days, where the Fed hints at easing, markets frequently rally.
Inflation Data and Consumer Sentiment
Economic reports such as the Consumer Price Index (CPI) and the Producer Price Index (PPI) are critical market movers. Inflation erodes the purchasing power of future cash flows, making stocks—especially growth stocks—less attractive. If today’s market was volatile, it may have been due to an “uncomfortably hot” inflation report, which signals to the market that the Fed might need to keep rates higher for longer.
Geopolitical Events and Global Stability
We live in a hyper-connected global economy. A conflict in the Middle East, a trade dispute between the U.S. and China, or a change in European energy policy can send ripples through the New York Stock Exchange within seconds. These events create uncertainty, and the market hates uncertainty. Geopolitical tension often leads to a “flight to quality,” where investors sell stocks and buy “safe-haven” assets like gold or U.S. Treasury bonds.
Sector-Specific Performance and Rotation
The headline index numbers often hide what is happening beneath the surface. Market “breadth”—the number of individual stocks participating in a move—is a vital metric for understanding the sustainability of a market trend.
Defensive vs. Cyclical Stocks
On days when the economy looks shaky, you might see “defensive” sectors like Utilities, Consumer Staples, and Healthcare performing well even if the overall market is down. These companies provide essential services that people need regardless of the economy. On the other hand, “cyclical” sectors like Financials, Industrials, and Consumer Discretionary thrive when the economy is expanding. Identifying which sectors led the market today helps reveal what stage of the economic cycle investors believe we are in.
The Impact of Earnings Season
Four times a year, publicly traded companies release their quarterly financial results. These reports are massive catalysts for individual stock prices and, by extension, the broader market. If a heavyweight like Apple or Microsoft reports better-than-expected earnings and provides strong future guidance, it can lift the entire tech sector. Conversely, a “miss” from a major retail giant can trigger a sell-off across the consumer sector as investors fear a slowdown in spending.
Beyond Equities: Bond Markets and Commodities
To truly answer how the markets did today, one must look past stocks. The “market” encompasses debt, currency, and raw materials, all of which interact with the equity market in predictable and unpredictable ways.
Treasury Yields and the Yield Curve
The bond market is often called the “smart money” because it is dominated by institutional players. The yield on the 10-year U.S. Treasury note is a critical benchmark. When yields rise, it means bond prices are falling, often because investors expect higher inflation or higher interest rates. A rapidly rising yield can act as a headwind for stocks because it increases the cost of capital and provides a “risk-free” alternative to the stock market.
Gold, Oil, and Alternative Assets
Commodities provide insight into supply chains and inflationary pressures. A spike in oil prices might be good for Energy stocks, but it is generally bad for the broader market as it acts as a “tax” on consumers and increases shipping costs for businesses. Gold, meanwhile, serves as a barometer for fear and currency devaluation. If gold is up significantly while stocks are down, it indicates a high level of anxiety among the investing public.
The Investor’s Perspective: How to Interpret Daily Market Movements
For the individual investor, the daily noise of the markets can be overwhelming. However, learning to filter this information is key to maintaining a disciplined financial strategy.
Distinguishing Signal from Noise
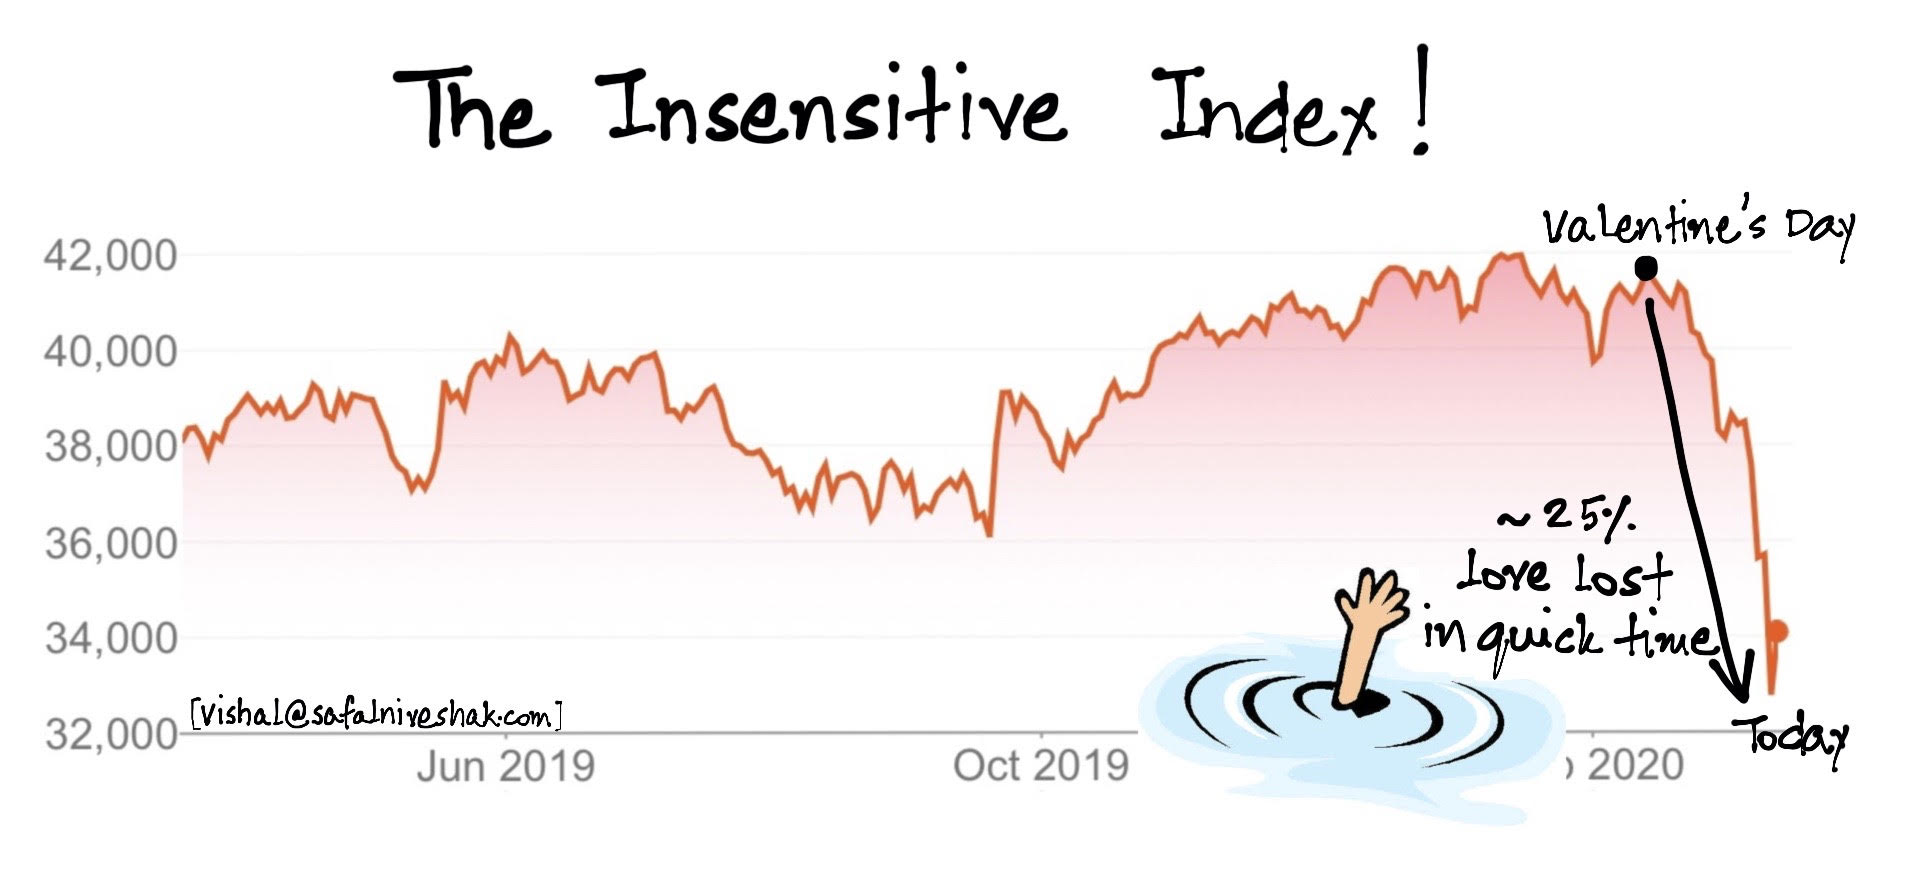
A 1% drop in the S&P 500 on a Tuesday might feel significant, but in the context of a decade of investing, it is often mere “noise.” Successful investors focus on the “signal”—long-term trends in corporate profitability, innovation, and economic policy. If the market is down today because of a temporary technical glitch or a minor geopolitical rumor, it may be an opportunity rather than a crisis.
The Importance of a Long-Term Strategy
The markets are a mechanism for transferring wealth from the impatient to the patient. While it is important to stay informed about “how the markets did today,” it is equally important not to let daily fluctuations dictate your long-term asset allocation. Diversification remains the only “free lunch” in finance, allowing investors to capture the growth of the winners while mitigating the impact of the losers.
In conclusion, “how the markets did today” is a question with many layers. It is a reflection of the collective expectations of millions of participants regarding the future of the global economy. By understanding the interplay between indices, macroeconomic data, sector rotations, and the bond market, you can move from being a passive observer of the news to an informed participant in your own financial future. Whether the day ended in green or red, the underlying data provides the map for where the economy is headed next.
aViewFromTheCave is a participant in the Amazon Services LLC Associates Program, an affiliate advertising program designed to provide a means for sites to earn advertising fees by advertising and linking to Amazon.com. Amazon, the Amazon logo, AmazonSupply, and the AmazonSupply logo are trademarks of Amazon.com, Inc. or its affiliates. As an Amazon Associate we earn affiliate commissions from qualifying purchases.