
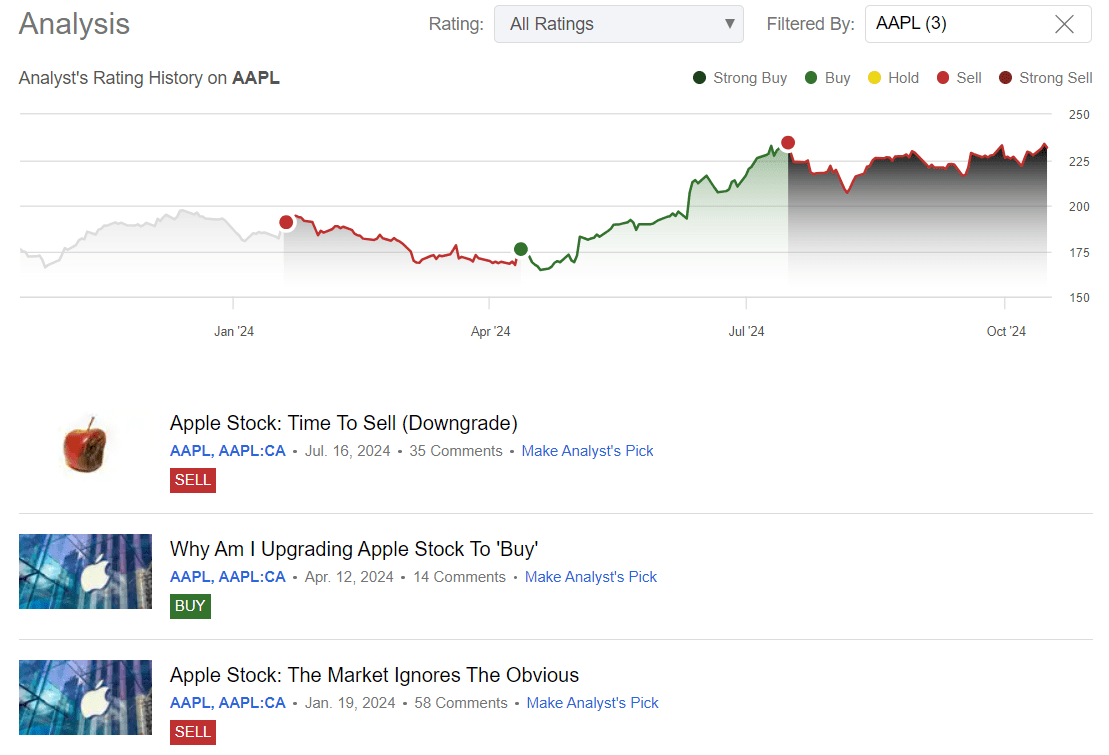
On January 17, 2024, Apple Inc. (AAPL) concluded the trading day at a closing price of $182.68. While this figure represents a single data point in the vast timeline of a trillion-dollar entity, it serves as a critical window into the financial climate of early 2024. For investors, analysts, and those focused on the “Money” sector, understanding this specific price point requires more than a glance at a ticker; it demands an exploration of the macroeconomic pressures, sector-specific challenges, and fundamental valuation metrics that define the world’s most influential consumer technology stock.

In the realm of personal finance and institutional investing, Apple is often viewed as a bellwether for the broader market. When Apple fluctuates, the S&P 500 and the Nasdaq-100 often follow suit. The mid-January period of 2024 was a time of transition, characterized by shifting expectations regarding interest rates and a renewed focus on corporate earnings. By deconstructing the $182.68 closing price, we can gain deeper insights into how large-cap equities are priced in an era of high-interest rates and evolving consumer demand.
Breaking Down the Numbers: AAPL’s Market Position on January 17, 2024
To understand the closing price of $182.68, one must first look at the intraday movement and the volume that supported it. On January 17, Apple’s stock opened at approximately $181.27, experienced a session high of $182.93, and a low of $180.30. The closing price marked a modest recovery from the day’s lows, yet it reflected a period of consolidation where the stock was searching for a definitive catalyst.
The Specifics of the $182.68 Closing Price
At the $182.68 mark, Apple’s market capitalization hovered around the $2.8 trillion threshold. For investors, this price point was significant because it sat comfortably above the 200-day moving average, a key technical indicator used to determine long-term bullish or bearish sentiment. However, it was notably lower than the all-time highs reached in late 2023. This “cooling off” period was essential for the market to digest previous gains and reassess Apple’s price-to-earnings (P/E) ratio, which remained elevated compared to historical averages.
Daily Volume and Liquidity Considerations
Trading volume on January 17 was substantial, as is typical for the most liquid stock in the world. High liquidity ensures that institutional investors—pension funds, ETFs, and mutual funds—can move large blocks of shares without causing extreme price slippage. The steady volume on this day suggested that despite the absence of a major news “shock,” there was a healthy exchange of hands between short-term speculators taking profits and long-term value investors building positions at what they perceived to be a fair entry point.
Macroeconomic Factors Influencing Apple’s Mid-January Performance
No stock exists in a vacuum. On January 17, 2024, the broader financial markets were grappling with “higher for longer” interest rate rhetoric from the Federal Reserve. As a “growth” stock that also yields a dividend, Apple is uniquely sensitive to the yields of the 10-year Treasury note. When bond yields rise, the discounted future cash flows of companies like Apple are perceived as less valuable, often leading to a downward revision in stock price.
Interest Rate Sentiment and Federal Reserve Speculation
In mid-January, the market was recalibrating its expectations for rate cuts. Earlier optimism that the Fed would pivot by March began to fade, replaced by a more cautious outlook. This shift directly impacted Apple’s valuation. For the money-conscious investor, the cost of capital is a primary concern; higher rates mean more expensive debt for consumers and potentially lower discretionary spending on premium electronics, which is the core of Apple’s revenue stream.
The Impact of Global Supply Chain Stability on Valuation
Financial analysts also looked toward the global stage during this period. Apple’s reliance on complex international supply chains makes its stock price a reflection of geopolitical stability. In January 2024, there were ongoing concerns regarding manufacturing diversification outside of China and the logistical costs associated with shipping disruptions in the Red Sea. These “invisible” costs are baked into the $182.68 price point, as professional traders price in the risk of margin compression due to increased freight and component costs.
Sector-Specific Headwinds Facing Apple in Early 2024

Beyond the macroeconomy, Apple faced several idiosyncratic risks that influenced its trading range in early 2024. From regulatory scrutiny to product cycle transitions, the “Money” side of the Apple story was focused on whether the company could maintain its industry-leading margins.
Regulatory Pressure and the Department of Justice
One of the primary weights on AAPL’s stock price in January was the looming shadow of antitrust litigation. Reports were circulating about the U.S. Department of Justice (DOJ) preparing a comprehensive antitrust lawsuit against the company’s “walled garden” ecosystem. In the world of finance, regulatory risk is one of the hardest variables to price accurately. Investors often apply a “regulatory discount” to the stock, which explains why AAPL was trading at $182.68 rather than testing its $200 psychological resistance level at that time.
Competitive Pressures in the Chinese Smartphone Market
For Apple, China is not just a manufacturing hub; it is its second-most important market. In January 2024, data began to emerge suggesting a resurgence of local competitors like Huawei. Financial analysts were concerned that Apple was losing market share in the high-end segment, leading to rare price discounts on the iPhone 15 in mainland China. For an investor, these discounts are a red flag for “brand power” and margin health, contributing to the sideways-to-downward pressure seen in the stock’s mid-January performance.
Assessing Apple as a Long-Term Investment Vehicle
Despite the short-term fluctuations that led to the $182.68 close, the fundamental “Money” thesis for Apple remains rooted in its ecosystem and its balance sheet. To understand the value of the stock, one must look past the daily price and into the company’s ability to generate “sticky” recurring revenue.
The Power of the Ecosystem and Services Revenue
A significant portion of Apple’s valuation is now driven by its Services segment. This includes the App Store, iCloud, Apple Music, and Apple Pay. Unlike hardware, which is cyclical and subject to supply chain shocks, Services revenue is high-margin and predictable. On January 17, savvy investors were looking at the growth rate of this segment. As long as the Services division continues to grow at double digits, it provides a “valuation floor” for the stock, preventing it from crashing even when iPhone sales are tepid.
Share Buybacks and Dividend Reliability
From a corporate finance perspective, Apple is a cash-generating machine. The company famously carries a “fortress balance sheet” with billions in cash reserves. A key driver of the stock price over the long term is Apple’s aggressive share buyback program. By reducing the total number of shares outstanding, the company increases the Earnings Per Share (EPS) for remaining investors. This financial engineering makes $182.68 an attractive price for those who believe in the company’s ability to continue returning capital to shareholders through both buybacks and a growing dividend.
Strategic Takeaways for the Modern Equity Investor
The closing price of AAPL on January 17, 2024, offers several lessons for those looking to manage their own portfolios or understand business finance. It highlights the importance of looking at a stock as a piece of a business rather than a fluctuating number on a screen.
Managing Volatility in Large-Cap Tech Stocks
For personal finance enthusiasts, the $182.68 price point serves as a reminder that even the most stable companies experience volatility. Investors who bought at the peak in December 2023 might have felt anxious in January 2024. However, those with a long-term horizon understand that “time in the market” beats “timing the market.” Utilizing strategies like Dollar Cost Averaging (DCA) allows investors to mitigate the risk of buying in at a temporary peak, turning volatility into an advantage.
The Importance of Technical and Fundamental Convergence
In conclusion, the price of $182.68 was the result of a collision between technical support levels and fundamental concerns. It was a moment of equilibrium where the market acknowledged Apple’s massive profitability while remaining wary of regulatory and competitive risks. For anyone involved in the business of money—whether as a retail investor or a financial professional—analyzing specific dates like January 17, 2024, provides a framework for evaluating how narrative and numbers interact to create market value.
Understanding the “why” behind a stock price is the difference between gambling and investing. As Apple continues to innovate with new product categories like spatial computing and AI integration, the lessons learned from its January 2024 performance will remain relevant for years to come.
aViewFromTheCave is a participant in the Amazon Services LLC Associates Program, an affiliate advertising program designed to provide a means for sites to earn advertising fees by advertising and linking to Amazon.com. Amazon, the Amazon logo, AmazonSupply, and the AmazonSupply logo are trademarks of Amazon.com, Inc. or its affiliates. As an Amazon Associate we earn affiliate commissions from qualifying purchases.