In the world of personal and business finance, numbers tell a story. However, an isolated figure—like a $5,000 profit or a $200 expense—rarely provides the full picture. To understand the trajectory of your wealth, the health of your investments, or the efficiency of your business operations, you must look at the relationship between numbers over time. This is where the concept of “percentage change” becomes the most vital tool in your financial arsenal.
Calculating the percentage change between two numbers allows you to quantify growth, measure decline, and compare performance across different asset classes regardless of their nominal value. Whether you are tracking the Year-over-Year (YoY) growth of your stock portfolio or analyzing the impact of inflation on your grocery bill, mastering this simple mathematical formula is a prerequisite for financial literacy.
Understanding the Fundamentals of Percentage Change in Finance
At its core, percentage change represents the relative difference between an old value and a new value. In financial terms, we often refer to these as the “initial investment” and the “current market value,” or the “previous budget” and the “actual spend.”
The Universal Formula for Financial Growth
To calculate the percentage change between two numbers, you follow a straightforward three-step process:
- Subtract the old number (Value A) from the new number (Value B). This gives you the absolute change.
- Divide that absolute change by the original old number (Value A).
- Multiply the result by 100 to convert it into a percentage.
Mathematically, it looks like this:
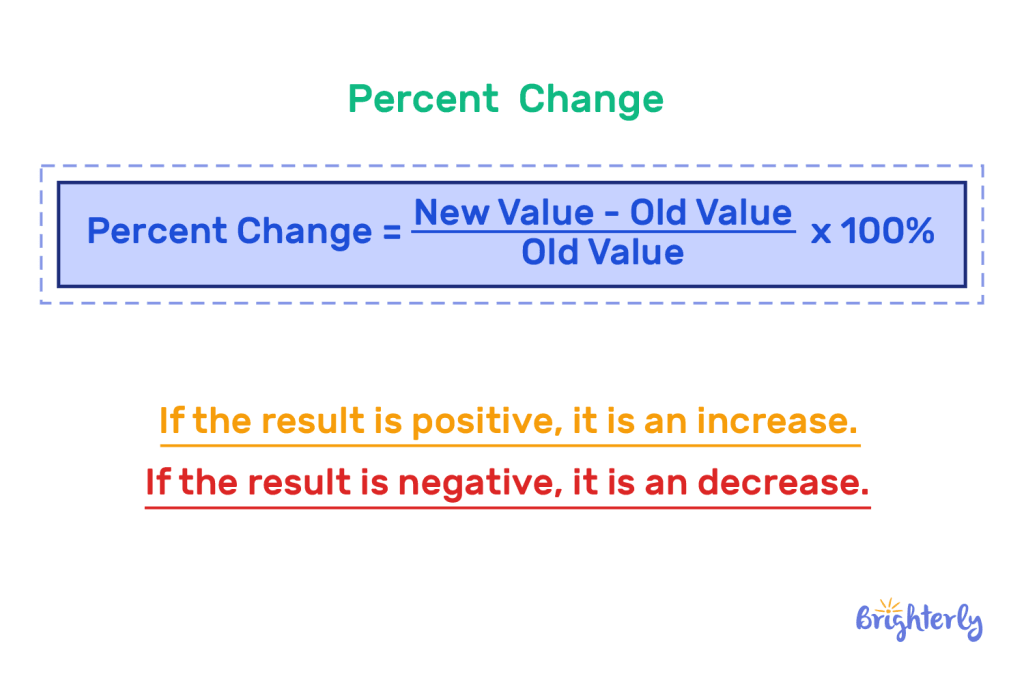
[(New Value – Old Value) / |Old Value|] × 100 = Percentage Change
For example, if you invested $1,000 in a mutual fund last year and it is now worth $1,250, your calculation would be:
($1,250 – $1,000) / $1,000 = 0.25.
0.25 × 100 = 25%.
Why Percentage Change Matters More Than Absolute Numbers
In money management, absolute numbers can be deceptive. A $500 gain sounds impressive until you realize it was made on a $50,000 investment (a mere 1% return). Conversely, a $500 gain on a $1,000 investment is a staggering 50% return.
By focusing on percentages, you create a “level playing field.” This allows a retail investor to compare their performance against a billionaire hedge fund manager or a small business owner to compare their growth against a Fortune 500 company. It shifts the focus from “how much money do I have?” to “how effectively is my money working for me?”
Practical Applications: Measuring Investment Performance
For the modern investor, the ability to calculate percentage change is the difference between emotional guesswork and data-driven decision-making. Volatility is a constant in the markets; understanding how to quantify that volatility helps in maintaining a disciplined long-term strategy.
Calculating ROI (Return on Investment)
Return on Investment (ROI) is perhaps the most frequent application of percentage change. When you evaluate the success of a capital allocation—be it in stocks, real estate, or a side hustle—you are essentially looking for the percentage increase from your entry point.
However, it is important to include all variables in your “New Value.” For instance, if you bought a rental property for $300,000 (Old Value) and sold it for $350,000 (New Value), but you also collected $20,000 in rent during that period, your true New Value is $370,000.
The calculation would be: ($370,000 – $300,000) / $300,000 = 23.3%.
Without the percentage calculation, you might struggle to compare this real estate venture to a simple index fund that returned 10% over the same period.
Evaluating Portfolio Volatility and Drawdowns
Understanding percentage change is equally important when the market moves against you. In finance, a “drawdown” is the percentage decline from a peak to a trough. If your portfolio drops from $100,000 to $80,000, that is a 20% decrease.
Calculations like these are vital for risk management. They help investors understand their “risk tolerance”—the amount of percentage loss they can stomach before making irrational, fear-based decisions. Seeing a “negative 15% change” on a dashboard is often more sobering and actionable than seeing a fluctuating dollar amount, as it provides a standardized metric of historical performance.
Business Finance: Tracking Growth and Profitability
For entrepreneurs and business owners, percentage change is the heartbeat of the company’s financial health. It is used to report to stakeholders, set quarterly goals, and identify areas of waste.

Analyzing Revenue Growth Year-over-Year (YoY)
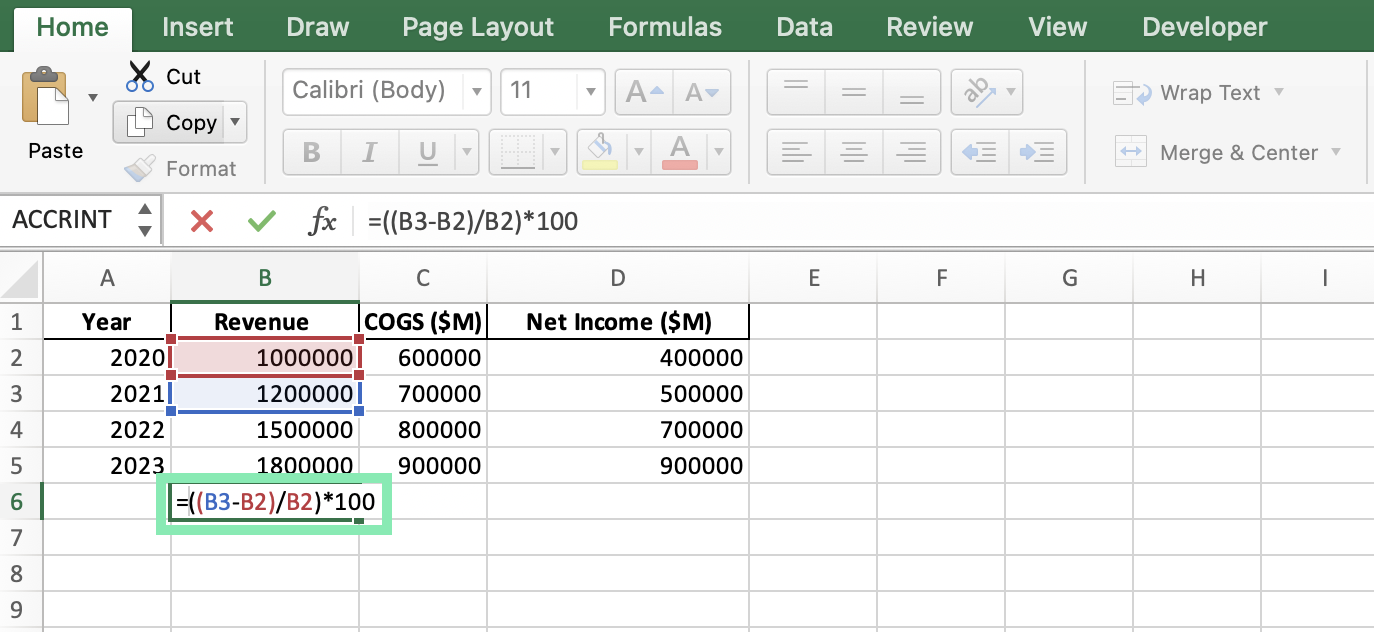
In business finance, we rarely look at monthly revenue in a vacuum because of seasonality. A toy store will naturally have higher revenue in December than in July. To get a true sense of growth, we use percentage change to compare “Like-for-Like” periods.
If a company earned $1.2 million in Q1 of 2023 and $1.5 million in Q1 of 2024, the percentage change is 25%. This “Year-over-Year” (YoY) metric is the gold standard for assessing whether a business is scaling or stagnating. Investors and lenders prioritize these percentage trends over raw totals because they indicate the company’s momentum and market share capture.
Monitoring Margin Fluctuations
Percentage change is also used to track internal efficiency through profit margins. Suppose your cost of goods sold (COGS) increases because a supplier raised their prices. If your COGS moves from $40 per unit to $44 per unit, that is a 10% increase in costs.
To maintain your profit margin, you must understand this percentage change so you can adjust your selling price accordingly. If you don’t calculate the percentage change of your expenses, you might find your “bottom line” shrinking even while your “top line” (revenue) is growing—a common trap for businesses that fail to monitor their financial metrics with precision.
Personal Finance: Managing Your Budget and Inflation
On an individual level, calculating percentage change is a fundamental skill for maintaining a sustainable lifestyle and protecting your purchasing power.
Tracking Changes in Monthly Expenses
A budget is a living document. By calculating the percentage change in your spending categories month-over-month, you can identify “lifestyle creep.” If your dining-out budget was $300 in January and hit $450 in March, that is a 50% increase.
While the $150 difference might seem manageable in isolation, identifying it as a 50% surge forces a more critical look at your habits. It allows you to ask: “Did my income also increase by 50%? If not, this category is cannibalizing my savings.” Using percentage change transforms a budget from a list of numbers into a diagnostic tool for financial behavior.
Understanding the Impact of Inflation on Purchasing Power
Inflation is essentially the percentage change in the “Consumer Price Index” (CPI). It measures how much more expensive a basket of goods has become compared to the previous year. If the inflation rate is 5%, it means the value of your cash has effectively decreased by that percentage in terms of what it can buy.
When you receive a 3% raise at work, it might feel like a win. However, if the percentage change in the cost of living (inflation) is 6% over that same period, your “real” income has actually decreased by approximately 3%. Without the ability to calculate and compare these percentages, you cannot accurately assess your true financial standing or negotiate a fair salary.
Common Pitfalls and How to Avoid Them
While the math is simple, the interpretation of percentage change in a financial context can often lead to confusion. Understanding these nuances is what separates a novice from a financially savvy individual.
The Percentage Increase vs. Decrease Paradox
One of the most important lessons in finance is that a percentage decrease requires a larger percentage increase to break even. This is known as the “asymmetry of returns.”
If you lose 50% of your money in a high-risk investment, you do not need a 50% gain to get back to where you started. You need a 100% gain.
Example:
- Start: $100
- 50% Loss: $50
- 50% Gain on $50: $75 (You are still down $25!)
- 100% Gain on $50: $100
This is why wealth preservation is so emphasized by financial experts. Large negative percentage changes are incredibly destructive because of the monumental effort required to recover the lost principal.
Dealing with Negative Numbers and Small Bases
In business finance, you may occasionally encounter “The Base Effect.” This happens when you are starting from a very small number. If a startup makes $1 in its first month and $10 in its second, that is a 900% increase. While technically true, the percentage change is misleading because the base (the starting number) was so low.
Additionally, calculating percentage change when the starting value is negative (such as a business moving from a net loss to a net profit) requires special attention. Standard formulas can break down when the “Old Value” is negative, often requiring you to use the absolute value of the denominator to ensure the direction of the change (positive or negative) is represented correctly.
By mastering the calculation of percentage change, you gain the ability to strip away the noise of raw data and see the underlying trends in your financial life. It is the language of growth, the measure of risk, and the most reliable map for your journey toward financial independence.
aViewFromTheCave is a participant in the Amazon Services LLC Associates Program, an affiliate advertising program designed to provide a means for sites to earn advertising fees by advertising and linking to Amazon.com. Amazon, the Amazon logo, AmazonSupply, and the AmazonSupply logo are trademarks of Amazon.com, Inc. or its affiliates. As an Amazon Associate we earn affiliate commissions from qualifying purchases.