
In the world of finance, numbers are the language of progress. However, progress is rarely a straight line upward. Whether you are tracking a stock market correction, analyzing a dip in quarterly business revenue, or evaluating the impact of inflation on your purchasing power, understanding how to find percentage decrease is a fundamental skill. It is more than just a mathematical exercise; it is a vital tool for risk management, strategic planning, and personal financial literacy.
Understanding how much value has been lost relative to its starting point allows investors and business owners to make informed decisions. A “10-point drop” in a stock price means very different things if the stock started at $20 versus $200. The percentage decrease provides the necessary context to assess the severity of a financial shift.
Understanding the Fundamentals of Percentage Decrease
At its core, calculating a percentage decrease is the process of finding the relative change between an initial value and a lower subsequent value. In financial terms, this represents the “rate of loss.”
The Core Formula and Its Logic
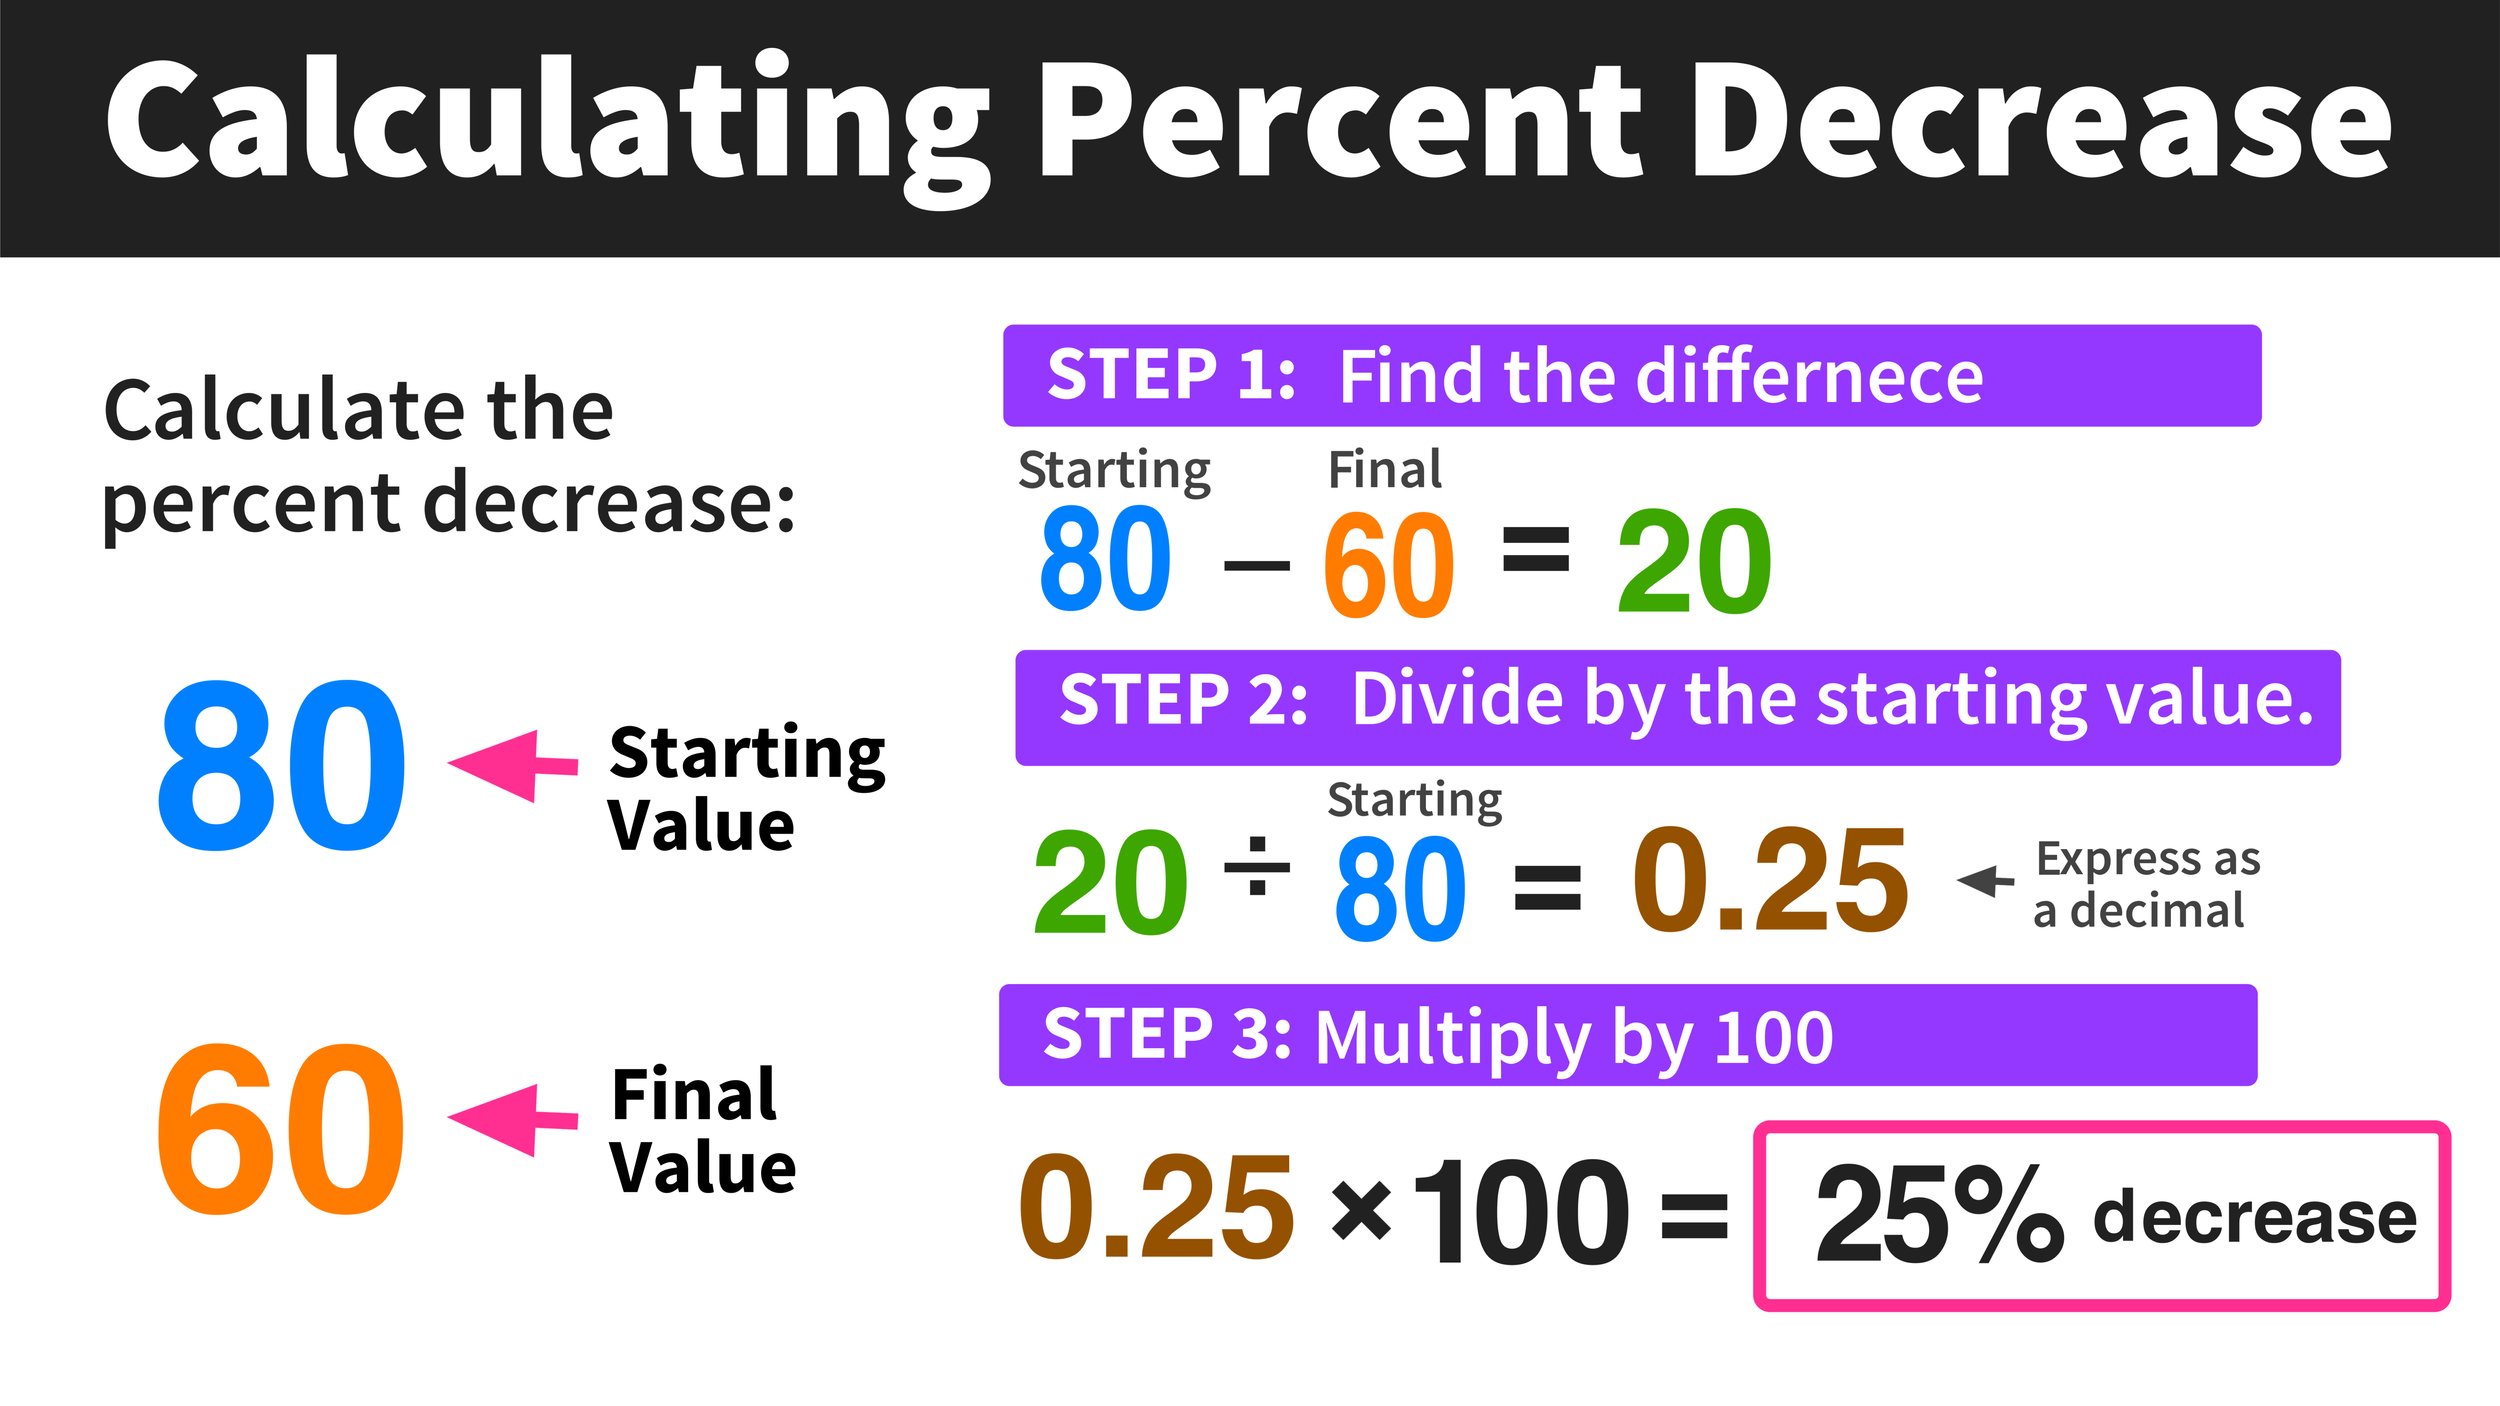
To find the percentage decrease, you follow a straightforward three-step logical process. First, subtract the new (lower) value from the original (higher) value to find the absolute difference. Second, divide that difference by the original value. Finally, multiply the result by 100 to convert it into a percentage.
The mathematical formula is expressed as:
Percentage Decrease = [(Original Value – New Value) / Original Value] × 100
For example, if a business’s monthly operating expenses were $10,000 last month and they successfully reduced them to $8,500 this month, the calculation would be:
- $10,000 – $8,500 = $1,500 (The absolute decrease)
- $1,500 / $10,000 = 0.15
- 0.15 × 100 = 15%
This 15% figure is a “normalized” metric, meaning you can compare this expense reduction to other departments or previous years, regardless of the total dollar amounts involved.
Real-World Financial Scenarios: Market Corrections and Budget Cuts
In personal finance, we often encounter percentage decreases during “market corrections.” A correction is generally defined as a 10% or greater decrease in the price of a stock index from its most recent peak. If the S&P 500 drops from 5,000 points to 4,400 points, applying the formula shows a 12% decrease.
Similarly, in corporate environments, managers are often tasked with “budget cuts.” If a department is told to find a 5% decrease in overhead, the manager must work backward from the percentage to find the dollar amount. Understanding the relationship between these numbers ensures that financial targets are met without accidentally over-slashing essential resources.
Analyzing Investment Performance: When the Numbers Go Down
For investors, the percentage decrease is a sobering but necessary metric. It is often referred to in the context of “drawdowns.” A drawdown measures the decline from a peak to a trough during a specific period for an investment or portfolio.
Calculating Drawdowns in Stock Portfolios
A drawdown is the peak-to-trough decline during a specific record period of an investment. It is usually quoted as the percentage between the peak and the subsequent trough. If your portfolio hits a high of $100,000 and then falls to $80,000, you have experienced a 20% drawdown.
Investors use this metric to understand the volatility and risk profile of an asset. A stock that frequently experiences 30% decreases might offer high rewards, but it requires a high risk tolerance. By calculating these percentages regularly, an investor can determine if their portfolio’s behavior aligns with their long-term financial goals.
The Impact of Compounding in Reverse
One of the most critical lessons in finance is that percentage decreases are harder to recover from than percentage increases are to achieve. This is due to the “asymmetric” nature of mathematical loss.
If you lose 50% of your investment, you do not need a 50% gain to get back to even; you need a 100% gain. For instance, if $1,000 drops by 50%, you are left with $500. To turn $500 back into $1,000, you must double your money—a 100% increase.
Understanding this concept highlights why protecting capital and minimizing percentage decreases is often more important for long-term wealth than chasing high-percentage gains. Successful wealth management is frequently about avoiding the “big miss.”

Percentage Decrease in Business Finance and Operations
In a business context, monitoring percentage decreases is essential for maintaining a healthy bottom line. Executives and financial analysts track these metrics to spot red flags in revenue or to celebrate efficiencies in cost management.
Measuring Revenue Decline and Churn Rates
For any subscription-based business (like a SaaS company or a gym), “churn” is a vital metric. Churn represents the percentage decrease in the customer base over a specific period. If a company starts the month with 1,000 subscribers and ends with 950 (excluding new sign-ups), they have experienced a 5% churn rate.
A consistent month-over-month percentage decrease in revenue or customer retention is an early warning sign of “product-market drift” or increased competition. By identifying the percentage decrease early, leadership can pivot strategies before the loss becomes insurmountable.
Cost Optimization and Expense Reduction
On the flip side, a percentage decrease can be a sign of success when applied to expenses. “Margin expansion” often occurs when a company can find a percentage decrease in the Cost of Goods Sold (COGS).
If a manufacturer finds a new supplier that reduces the cost of raw materials from $50 per unit to $42 per unit, they have achieved a 16% decrease in material costs. This efficiency directly increases the gross profit margin. In the competitive world of business finance, these small percentage decreases in expenses often accumulate to create a massive competitive advantage.
The Psychological and Strategic Implications of Financial Devaluation
Money is as much about psychology as it is about math. The way we perceive a percentage decrease can significantly impact our financial decision-making.
Overcoming the “Loss Aversion” Bias
Behavioral economics teaches us about “loss aversion”—the tendency for humans to feel the pain of a loss twice as strongly as the joy of a gain. A 10% decrease in a retirement account often triggers more emotional distress than the excitement generated by a 10% increase.
By strictly adhering to the math of percentage decrease, investors can detach themselves from the emotional “sting” of a declining balance. Seeing a market dip as a “10% decrease” rather than “losing $20,000” helps in maintaining a long-term perspective. It allows the investor to ask: “Is this a fundamental shift in value, or a temporary fluctuation?”
Strategic Rebalancing After a Decrease
When an asset class within a portfolio experiences a significant percentage decrease, it often changes the overall “asset allocation.” For example, if you aim for a portfolio of 60% stocks and 40% bonds, a 20% decrease in the stock market will leave you “underweight” in stocks.
Sophisticated investors use these moments to “rebalance.” They sell some of the assets that stayed steady (the bonds) to buy the assets that decreased (the stocks) while they are “on sale.” In this scenario, the percentage decrease serves as a signal to buy low, ensuring the portfolio stays aligned with the original risk strategy.
Tools and Digital Resources for Financial Calculation
While the formula is simple, the modern financial landscape moves too quickly for manual calculations in every instance. Utilizing digital tools can help maintain accuracy and speed in financial analysis.
Using Excel and Google Sheets for Automated Analysis
For business owners and serious investors, spreadsheet software is the gold standard for tracking percentage changes. In Excel, if your original value is in cell A1 and your new value is in cell B1, the formula for percentage decrease is:
=(A1-B1)/A1
You then format the cell as a “Percentage.” The advantage of using spreadsheets is the ability to track trends over time. You can visualize a series of monthly percentage decreases using charts, which makes it easier to spot seasonal trends or long-term declines in business performance.
Financial Calculators for Quick Decision Making
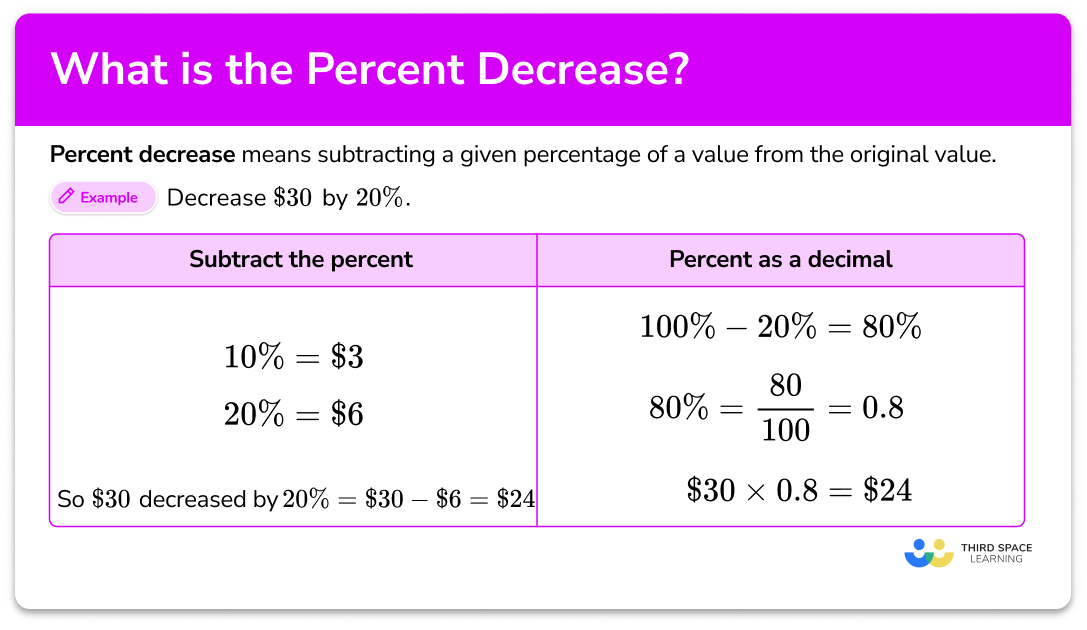
There are numerous online financial calculators and mobile apps designed for “on-the-fly” calculations. These are particularly useful for real estate investors or shoppers. If a property’s price is reduced from $500,000 to $475,000, a quick calculation reveals a 5% decrease.
In a professional negotiation, being able to quickly calculate that a “5% discount” is more or less favorable than a “flat $10,000 credit” is an invaluable skill. Whether you use a high-powered spreadsheet or a simple calculator, the goal remains the same: transforming raw numbers into actionable financial intelligence.
By mastering the calculation of percentage decrease, you gain a clearer lens through which to view your financial world. It moves you away from guesswork and emotional reactions toward a disciplined, data-driven approach to wealth management and business growth. Whether the news is good or bad, the percentage tells the real story.
aViewFromTheCave is a participant in the Amazon Services LLC Associates Program, an affiliate advertising program designed to provide a means for sites to earn advertising fees by advertising and linking to Amazon.com. Amazon, the Amazon logo, AmazonSupply, and the AmazonSupply logo are trademarks of Amazon.com, Inc. or its affiliates. As an Amazon Associate we earn affiliate commissions from qualifying purchases.