In the realm of finance, numbers are the language of progress. Whether you are tracking the growth of a personal savings account, evaluating the performance of a stock portfolio, or managing the quarterly budget of a multinational corporation, the ability to interpret changes in data is paramount. One of the most fundamental yet misunderstood calculations in this discipline is the percentage difference.
While simple addition and subtraction tell us the “what,” the percentage difference tells us the “how much” in relative terms. Understanding how to figure out percentage difference allows investors and business owners to strip away the noise of raw numbers and focus on the actual velocity of change. This guide explores the mechanics of this calculation and its critical applications across the landscape of personal and business finance.

The Fundamentals of Percentage Difference in Personal and Business Finance
To master financial analysis, one must first master the arithmetic of change. Percentage difference is a comparison between two values—typically an old value and a new value—expressed as a portion of the original amount. It provides a standardized way to view growth or decline, regardless of the scale of the currency involved.
Defining the Formula: New vs. Old Value
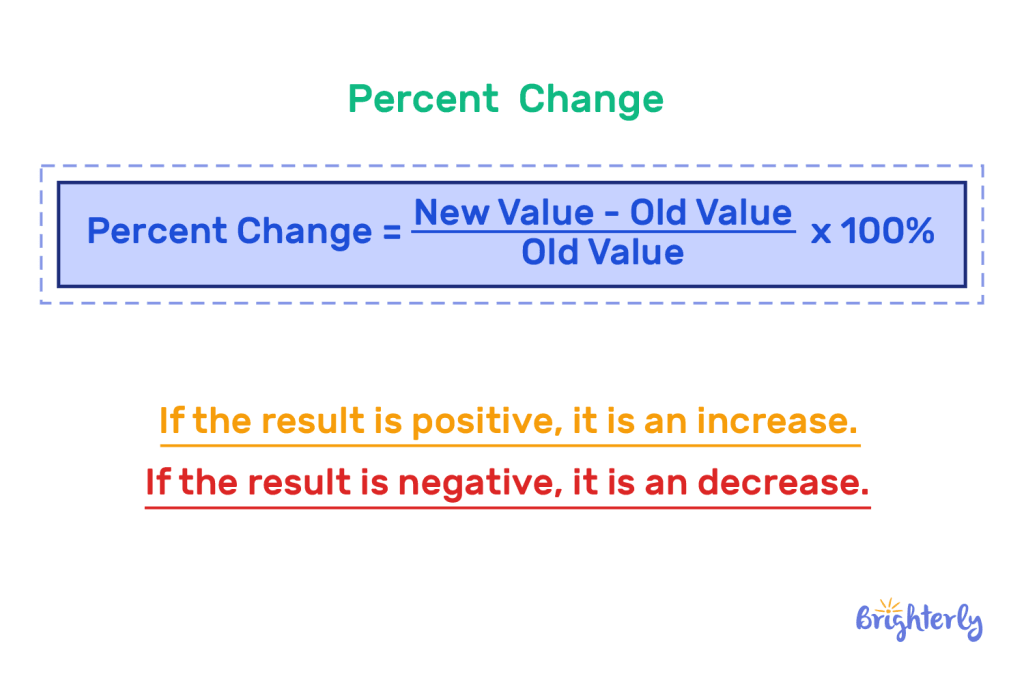
The mathematical foundation for calculating percentage difference is straightforward, but its application requires precision. The formula is:
Percentage Difference = ((New Value – Old Value) / |Old Value|) × 100
In financial terms, the “Old Value” is your baseline—perhaps last year’s revenue or the initial price of a bond. The “New Value” is the current state of that asset. By subtracting the old from the new, you find the absolute change. Dividing that change by the old value contextualizes it, and multiplying by 100 converts it into a readable percentage. This allows a small business owner to see that a $5,000 increase on a $50,000 revenue stream is a 10% gain, providing a clear metric for success.
Percentage Increase vs. Percentage Decrease
Financial trends are rarely linear, and the direction of change matters immensely. A percentage increase indicates growth, signaling that an investment is appreciating or that a business is expanding its market reach. Conversely, a percentage decrease indicates a contraction or loss.
It is important to note the “asymmetry of percentages,” a concept crucial for any investor. For example, if a financial asset drops by 50% in value, it requires a 100% increase to return to its original price. Understanding this mathematical reality helps individuals better assess risk and manage their expectations regarding market recovery and capital preservation.
Why Accuracy Matters in Financial Reporting
In corporate finance, precision is not just a preference; it is a regulatory and operational necessity. Stakeholders, from shareholders to tax authorities, rely on accurate percentage difference reporting to judge the health of an entity.
A rounding error or a miscalculation in percentage difference can lead to skewed perceptions of profitability. For instance, if a company reports a 15% increase in operational costs when the actual figure is 18%, it masks a significant inefficiency that could threaten long-term solvency. Accurate calculations ensure that financial strategies are based on reality rather than mathematical illusions.
Measuring Investment Performance and Portfolio Growth
For the individual investor, the percentage difference is the primary metric for evaluating the success of their wealth-building efforts. While raw dollar gains feel rewarding, they do not tell the whole story of efficiency and opportunity cost.
Tracking Year-over-Year (YoY) Asset Growth
One of the most common applications of percentage difference is Year-over-Year (YoY) analysis. By comparing the value of a retirement account or a real estate asset on December 31st of one year to the same date the following year, an investor can gauge their real progress toward financial independence.
YoY calculations smooth out the “noise” of daily market fluctuations, providing a high-level view of whether an investment strategy is working. If the S&P 500 grew by 10% in a year, but an individual’s private portfolio only grew by 4%, the percentage difference highlights an underperformance that warrants a re-evaluation of asset allocation.
Evaluating Stock Market Volatility
Volatility is often measured by the percentage difference between a stock’s high and low prices over a specific period. Investors use this to determine the “beta” or risk level of a security. A stock that experiences a 20% price swing within a single week is significantly more volatile than a blue-chip stock that moves by only 2%.
By calculating these differences, investors can set “stop-loss” orders—automated sell commands triggered when a stock drops by a certain percentage—to protect their capital from catastrophic downturns.
Comparing Mutual Fund and ETF Returns
When choosing between different investment vehicles, such as Mutual Funds or Exchange-Traded Funds (ETFs), percentage difference allows for an “apples-to-apples” comparison. An investor might look at two funds: Fund A, which gained $500 per share, and Fund B, which gained $50 per share. Without calculating the percentage difference based on the initial share price, the investor might wrongly assume Fund A is the better performer. If Fund A started at $5,000 (a 10% gain) and Fund B started at $250 (a 20% gain), Fund B is actually the superior investment in terms of yield.
Business Finance: Using Percentage Difference to Drive Profitability
In a business context, percentage difference is the engine behind Key Performance Indicators (KPIs). It allows managers to transform raw accounting data into actionable insights that can influence pivot strategies or expansion plans.
Analyzing Revenue Fluctuations and Sales Targets
Sales teams live and die by percentage growth. Managers use the percentage difference to compare current monthly sales against the same month in the previous year (Month-over-Month or Year-over-Year). This identifies seasonal trends—such as a retail business seeing a 40% spike in December—and helps in setting realistic future targets. If a company aims for a 15% increase in sales but only achieves a 5% difference, the calculation serves as an early warning system to adjust marketing tactics or product pricing.
Calculating Margin Changes and Cost of Goods Sold (COGS)
Profitability is not just about how much you sell, but how much you keep. The percentage difference is vital when monitoring the Cost of Goods Sold (COGS). If the price of raw materials increases by 12% due to supply chain disruptions, but the business only increases its product price by 5%, the profit margin is being squeezed.
By constantly calculating the percentage difference in overhead and production costs, CFOs can determine exactly when a price hike is necessary to maintain the company’s bottom line.
Budget Variance Analysis: Planned vs. Actual
Every robust business operates on a budget. At the end of a fiscal quarter, finance teams perform a “variance analysis,” which is essentially calculating the percentage difference between the budgeted amount and the actual expenditure.
A 2% variance might be acceptable, but a 20% variance in “Travel and Entertainment” expenses indicates a lack of fiscal discipline. This comparative analysis allows leadership to hold departments accountable and reallocate funds to more productive areas of the business.
Practical Applications in Personal Finance and Savings
Beyond the boardroom and the stock exchange, the ability to figure out percentage difference is a survival skill in the modern economy. It empowers consumers to make smarter choices with their hard-earned money.
Understanding Inflation and Purchasing Power
Inflation is measured as the percentage difference in the Consumer Price Index (CPI) over time. If the annual inflation rate is 7%, it means that, on average, the cost of goods has increased by that percentage. For a household, this means their purchasing power has decreased.
By calculating the percentage difference between their annual salary increase and the inflation rate, individuals can determine their “real” wage growth. If you receive a 3% raise but inflation is at 7%, you have effectively experienced a 4% decrease in your standard of living.
Comparing Interest Rates on Loans and Savings Accounts
When shopping for a mortgage or a high-yield savings account, small percentage differences result in massive long-term financial impacts. On a $400,000 home loan, the difference between a 6% interest rate and a 7% interest rate might seem negligible, but calculating the percentage difference in total interest paid over 30 years reveals a cost discrepancy of tens of thousands of dollars.
Similarly, for savers, moving money from a traditional bank offering 0.01% interest to a digital bank offering 4.5% represents a staggering percentage difference in yield, which can significantly accelerate the growth of an emergency fund.

Optimizing Household Spending Through Comparative Analysis
Budgeting apps and spreadsheets often use percentage difference to show users where their money is going. If your grocery bill was $400 last month and is $600 this month, that is a 50% increase. This percentage highlights a lifestyle change or a price surge more effectively than the raw $200 figure might. By tracking these percentages across categories like utilities, subscriptions, and dining out, individuals can identify “budget leaks” and make conscious decisions to redirect those funds toward debt repayment or investments.
In conclusion, knowing how to figure out percentage difference is more than just a mathematical exercise; it is a fundamental pillar of financial intelligence. From the macro-level analysis of global markets to the micro-level management of a household budget, this simple calculation provides the clarity needed to navigate a complex economic world. By viewing financial changes through the lens of percentages, you gain the perspective required to build lasting wealth and run a resilient business.
aViewFromTheCave is a participant in the Amazon Services LLC Associates Program, an affiliate advertising program designed to provide a means for sites to earn advertising fees by advertising and linking to Amazon.com. Amazon, the Amazon logo, AmazonSupply, and the AmazonSupply logo are trademarks of Amazon.com, Inc. or its affiliates. As an Amazon Associate we earn affiliate commissions from qualifying purchases.