In the world of finance, numbers are the primary language of communication. Whether you are tracking the performance of a stock portfolio, analyzing the growth of a small business, or simply trying to understand how inflation is eating away at your purchasing power, one mathematical concept stands above the rest: percentage change. While it may seem like a basic arithmetic operation, the ability to calculate and interpret percentage change is the bedrock of sound financial decision-making.
Understanding how to work out percentage change allows an individual to move beyond raw data and into the realm of meaningful insights. It transforms a simple statement like “my investment grew by $500” into a far more descriptive “my investment grew by 15%.” This distinction is vital because, in money management, relativity is everything. This article explores the mechanics of percentage change within the financial sector, its applications in investing and business, and why it is the most critical tool in your financial toolkit.
The Fundamentals of Financial Growth: Understanding Percentage Change
At its core, percentage change measures the relationship between an old value and a new value. In financial terms, this usually represents the growth or decline of an asset, an expense, or a revenue stream over a specific period. To navigate the complexities of personal and corporate finance, one must first master the basic logic of this calculation.
The Basic Formula for Financial Calculations
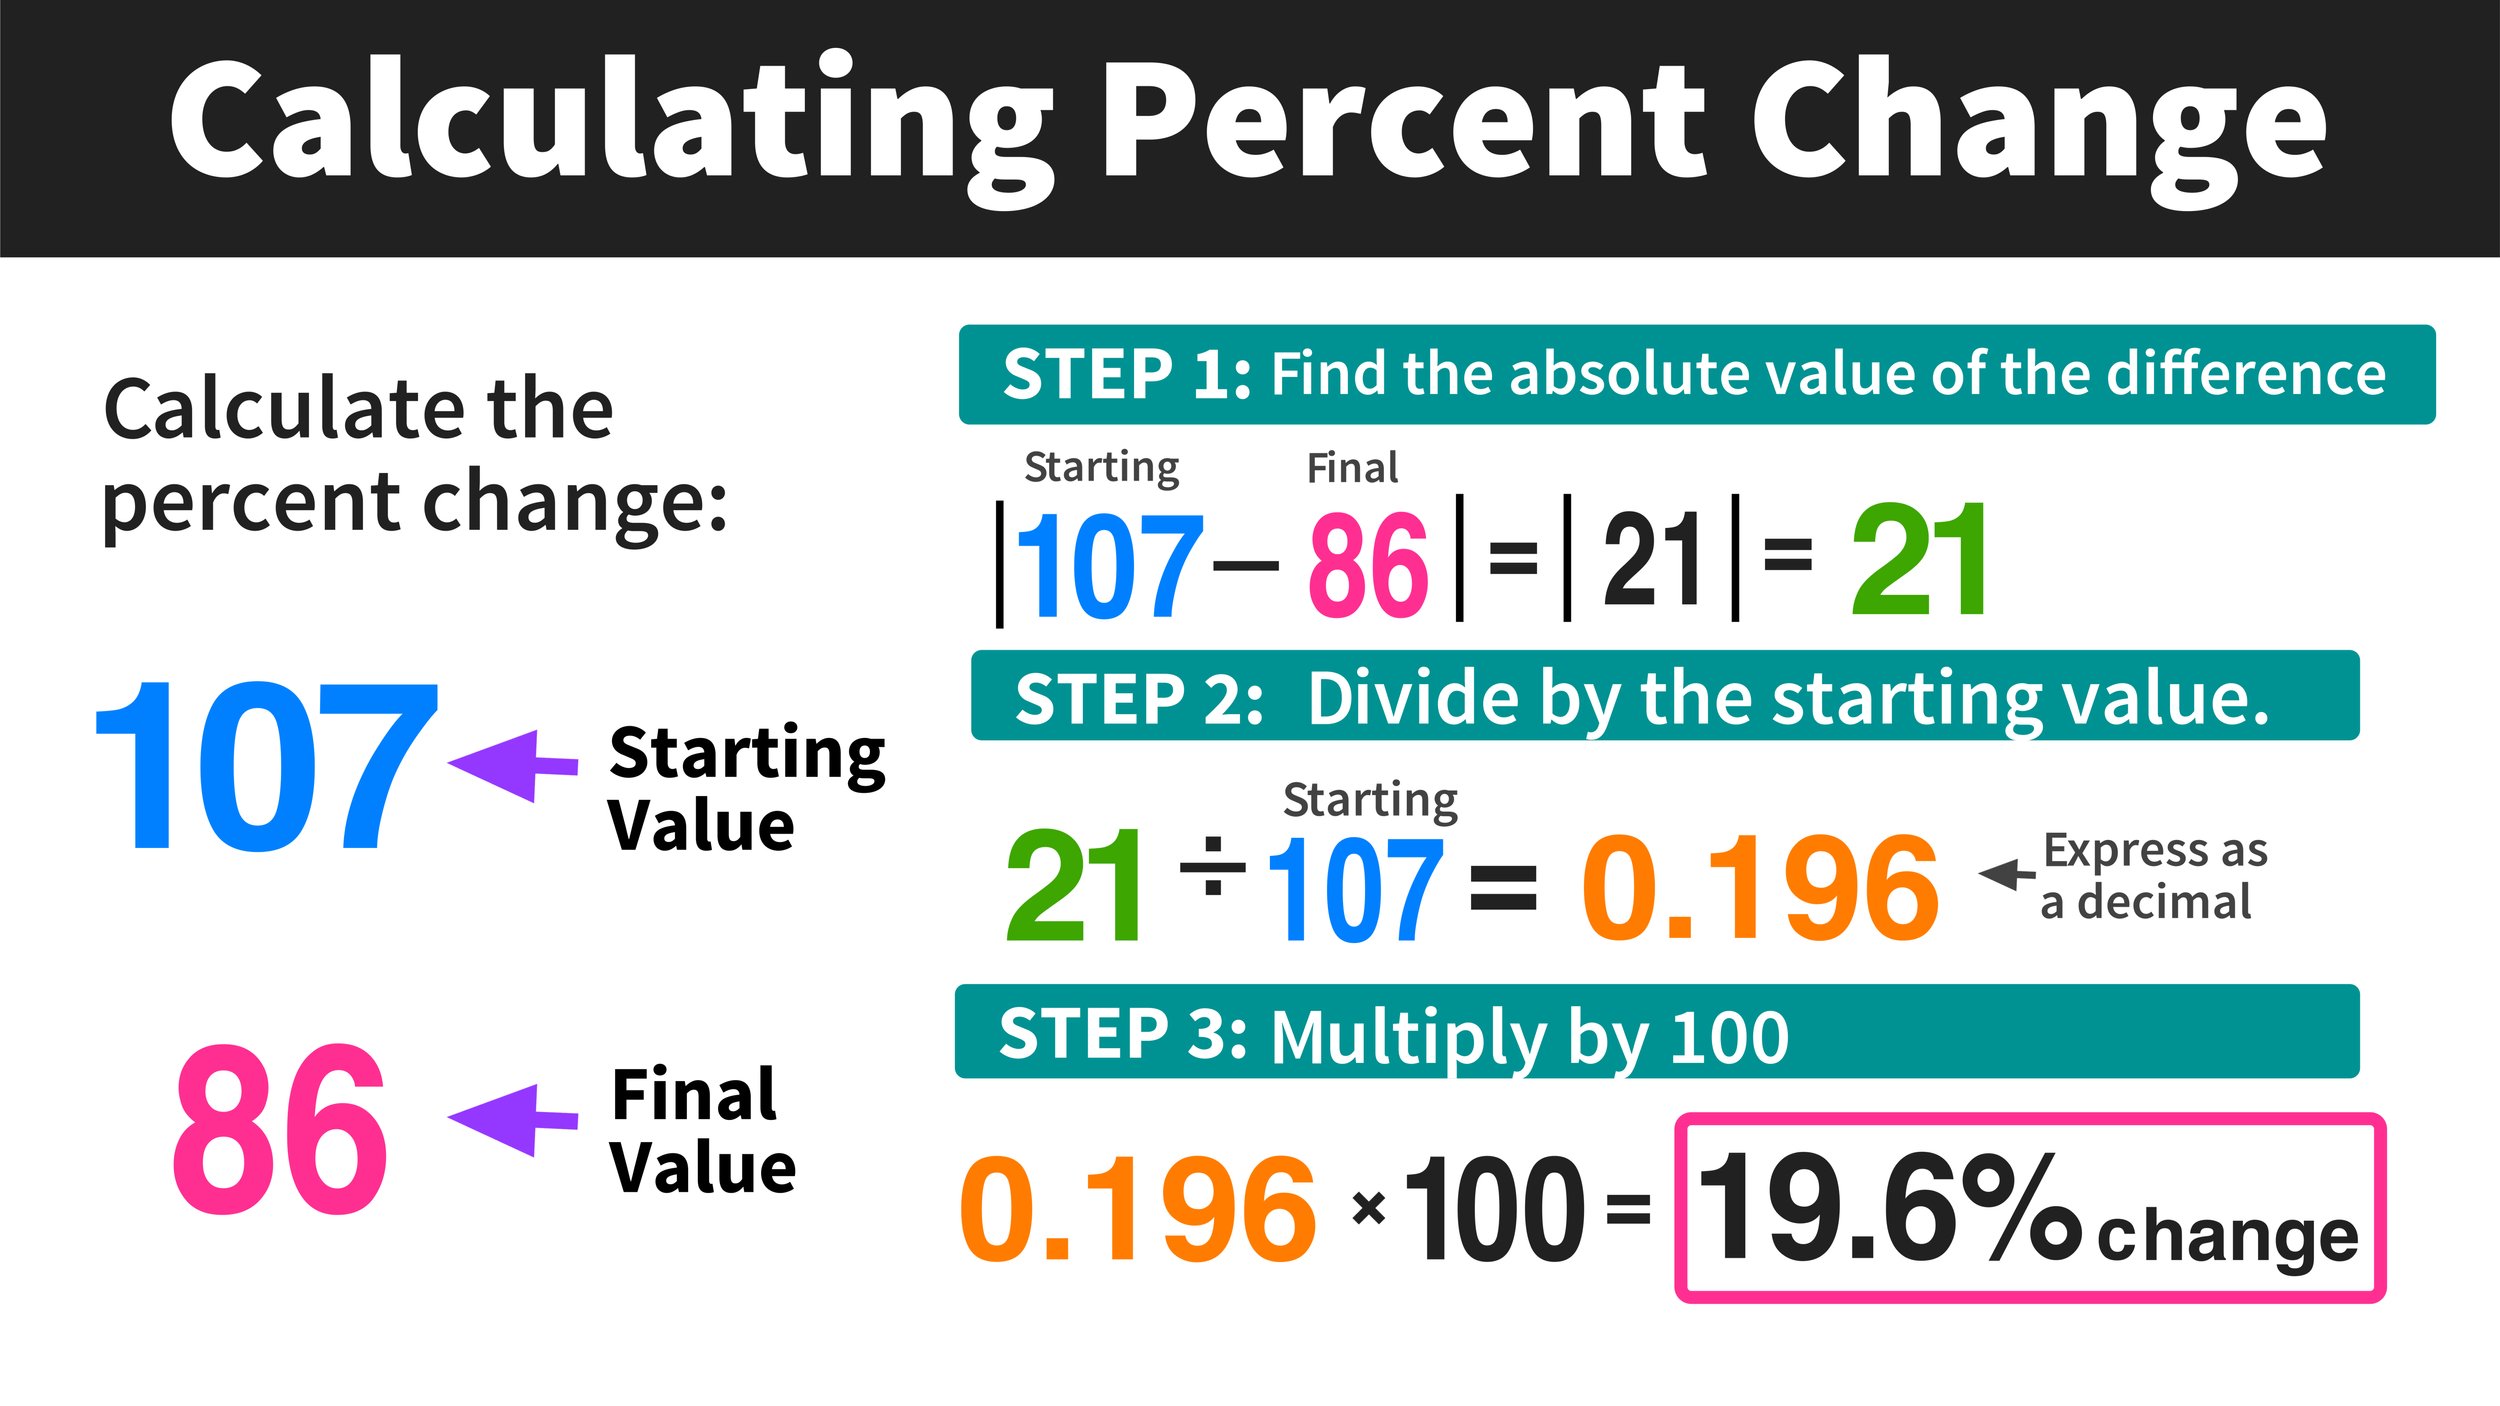
The mathematical formula for percentage change is straightforward, yet its implications are profound. To find the percentage change, you subtract the original value (the “old” value) from the current value (the “new” value), divide that result by the original value, and then multiply by 100.
Formula: [(New Value – Old Value) / Old Value] × 100
For example, if you purchased a share of a company for $150 and it is now worth $180, the calculation would be:
- $180 – $150 = $30 (The absolute change)
- $30 / $150 = 0.2
- 0.2 × 100 = 20%
This 20% increase provides a standardized way to compare this investment against others, regardless of the initial dollar amount invested.
Why Precision Matters in Personal Finance
In personal finance, accuracy in these calculations prevents emotional decision-making. Investors often fall into the trap of looking at absolute dollar amounts. A $1,000 gain feels significant, but if that gain came from a $100,000 investment, it represents only a 1% return—likely underperforming even a basic savings account. Conversely, a $200 gain on a $1,000 investment is a 20% return, which is exceptional. By focusing on percentage change, you can objectively evaluate where your capital is most productive.
Percentage Change in Investing: Measuring Performance and Volatility
For the modern investor, percentage change is the primary metric used to evaluate the health of an asset. From the daily fluctuations of the S&P 500 to the long-term yields of government bonds, percentage change provides the context necessary to build a diversified and resilient portfolio.
Calculating Return on Investment (ROI)
Return on Investment, or ROI, is perhaps the most frequent application of percentage change in the financial world. It allows investors to compare the efficiency of different investments. When calculating ROI, the “Old Value” is your initial capital outlay (including commissions or fees), and the “New Value” is the current market value or the proceeds from a sale.
A crucial aspect of ROI that often surprises novice investors is the “Asymmetry of Loss.” If an investment drops by 50%, it requires a 100% gain just to return to the original break-even point. Understanding this mathematical reality highlights the importance of risk management; preventing a large negative percentage change is often more important for long-term wealth than chasing the highest positive percentage change.
Understanding Compounding and Cumulative Change
When looking at financial growth over several years, we often deal with cumulative percentage change. This is the total change from the beginning of a period to the end, accounting for all the ups and downs in between. However, professional investors also look at the Compound Annual Growth Rate (CAGR).
While a simple percentage change tells you how much you made in total, the CAGR tells you what your annual return would have been if the investment had grown at a steady rate each year. This is vital for comparing a volatile stock’s performance against a “fixed-income” asset like a bond. Without knowing how to work out these varying types of percentage changes, an investor is essentially flying blind.
Business Finance: Monitoring Margins and Revenue Growth
In the corporate world, percentage change is the pulse of the company. It is used by executives, stakeholders, and analysts to determine if a business is scaling efficiently or if it is heading toward a liquidity crisis.
Tracking Year-over-Year (YoY) Growth
One of the most important metrics in business is Year-over-Year (YoY) growth. This compares a financial metric (like revenue or net profit) for one period against the same period in the previous year. This use of percentage change is essential because it accounts for seasonality. For example, a retail business may see a 50% increase in sales in December compared to November, but the more important question is: what was the percentage change compared to last December?
If the YoY growth is positive, the business is expanding. If it is negative, even if the monthly sales are high, the business may be losing market share. This high-level view allows business owners to identify trends before they become irreversible problems.
Analyzing Cost Fluctuations and Profit Margins
Percentage change is equally important on the expense side of the ledger. If a company’s revenue grows by 10% but its operating costs grow by 15%, the business is actually becoming less profitable despite “making more money.” This is known as “margin compression.”
By calculating the percentage change in Cost of Goods Sold (COGS) relative to the percentage change in revenue, management can identify inefficiencies. For instance, if the price of raw materials increases by 5%, a business must decide whether to absorb that cost (lowering their profit margin) or increase their own prices by a certain percentage to maintain their financial health.
Economic Indicators: Inflation and Purchasing Power
On a macroeconomic level, percentage change is the tool used to measure the health of entire nations. For the individual, understanding these percentages is key to protecting one’s lifestyle and retirement savings.
How Percentage Change Defines the Consumer Price Index (CPI)
Inflation is defined as the rate at which the general level of prices for goods and services is rising. It is almost always expressed as a percentage change. Central banks, such as the Federal Reserve, target a specific percentage change in the Consumer Price Index (CPI)—usually around 2%—to maintain economic stability.
When you hear that “inflation is at 5%,” that is a percentage change calculation comparing current prices to prices from one year ago. For a consumer, this means that their “real” wealth is decreasing by that same percentage unless their income or investment returns exceed that rate.
Adjusting for Inflation in Long-term Planning
To truly understand your financial position, you must calculate “real” percentage change versus “nominal” percentage change. If your savings account offers a 4% interest rate (nominal change), but inflation is at 5%, your “real” percentage change is -1%. You are technically losing purchasing power despite your balance increasing. This distinction is vital for long-term retirement planning, as it ensures that your future “New Value” will actually be enough to cover the cost of living.
Practical Tools and Strategies for Accuracy
While the formula for percentage change is simple, applying it consistently across a complex financial life requires the right tools and a disciplined approach.
Leveraging Financial Calculators and Spreadsheets
In professional settings, manual calculations are often replaced by software like Microsoft Excel or Google Sheets. In these programs, the percentage change formula is often entered as: =(B2-A2)/A2, where B2 is the new price and A2 is the old price. Setting the cell format to “Percentage” automatically handles the “multiply by 100” step.
Using spreadsheets allows you to track “rolling” percentage changes—looking at performance over trailing 3-month, 6-month, or 12-month periods. This helps smooth out “noise” (temporary market fluctuations) and reveals the true underlying trend of your finances.

Avoiding Common Mathematical Pitfalls in Money Management
A common mistake in financial reporting is confusing “percentage points” with “percentage change.” If a mortgage rate moves from 3% to 4%, it has increased by one percentage point, but the percentage change in the interest cost is actually 33.3% ( [4-3] / 3 ).
Another pitfall is failing to account for the “Base Effect.” A 10% increase on a $1,000,000 portfolio ($100,000) is much more significant in absolute terms than a 50% increase on a $1,000 portfolio ($500). When managing money, always keep the base value in mind to maintain perspective on the actual impact on your net worth.
In conclusion, mastering how to work out percentage change is more than just a math exercise; it is a fundamental financial skill. It allows you to strip away the distractions of large numbers and see the underlying reality of your investments, your business, and the economy. By consistently applying this metric, you can make more informed, objective, and ultimately more profitable financial decisions.
aViewFromTheCave is a participant in the Amazon Services LLC Associates Program, an affiliate advertising program designed to provide a means for sites to earn advertising fees by advertising and linking to Amazon.com. Amazon, the Amazon logo, AmazonSupply, and the AmazonSupply logo are trademarks of Amazon.com, Inc. or its affiliates. As an Amazon Associate we earn affiliate commissions from qualifying purchases.