
For millions of investors, financial analysts, and casual observers, the question “What did the Dow Jones close at yesterday?” is a ritualistic part of the daily routine. This single number, flashed across news tickers and smartphone notifications every weekday at 4:00 PM Eastern Time, serves as a primary pulse check for the American economy. However, the closing price of the Dow Jones Industrial Average (DJIA) is far more than just a numerical value; it is a complex synthesis of global sentiment, corporate health, and macroeconomic policy. To truly understand what yesterday’s close means for your personal finance and investment strategy, one must look beneath the surface of the ticker symbol.

Decoding the Dow Jones Industrial Average (DJIA)
The Dow Jones Industrial Average is the second-oldest stock market index in the United States, trailing only the Dow Jones Transportation Average. Created by Charles Dow and Edward Jones in 1896, it was designed to provide a snapshot of the health of the American industrial sector. Over a century later, while the “industrial” moniker remains, the index has evolved to represent a cross-section of the entire U.S. economy.
The History and Evolution of the Blue-Chip Index
When it debuted, the Dow consisted of only 12 companies, primarily in the heavy industry, railroad, and energy sectors. Today, it comprises 30 “blue-chip” companies—large, reputable, and financially sound corporations that are leaders in their respective industries. These include tech giants like Apple and Microsoft, healthcare leaders like UnitedHealth Group, and consumer staples like Coca-Cola. The evolution of the Dow reflects the shifting landscape of the American economy, moving from a manufacturing-based system to one dominated by technology, services, and finance.
How the Dow is Calculated: The Price-Weighted Model
Unlike the S&P 500 or the Nasdaq Composite, which are market-capitalization-weighted, the Dow is a price-weighted index. This means that companies with higher share prices have a greater influence on the index’s movement than those with lower share prices, regardless of the company’s total market value.
To maintain consistency when stocks split or when a company is replaced in the index, the “Dow Divisor” is used. This is a mathematical constant that adjusts the sum of the prices of the 30 stocks. Because of this unique calculation, a $5 move in a high-priced stock like Goldman Sachs will impact the Dow much more significantly than a $5 move in a lower-priced stock, even if the lower-priced company has a larger overall market cap. Understanding this mechanic is crucial for investors who want to know why the Dow closed at a specific level yesterday despite mixed performance across the broader market.
Why Yesterday’s Close Matters to Your Portfolio
The closing price of the Dow is widely considered the “official” price for the trading day. While trading continues in the after-hours market, the 4:00 PM close is the benchmark used by mutual funds to calculate Net Asset Value (NAV) and by institutional investors to rebalance portfolios.
Market Sentiment and the “Closing Bell” Psychology
The closing price represents the final consensus of value between buyers and sellers for that day. It often reflects how investors have processed the day’s news, from earnings reports to geopolitical shifts. A “strong close”—where the index finishes near its daily high—often suggests positive momentum that may carry over into the next trading session. Conversely, a “weak close” can signal that investors are nervous, potentially leading to a sell-off the following morning. For the individual investor, yesterday’s close provides a psychological anchor, helping to define whether the current market environment is one of “greed” or “fear.”
Technical Analysis: Support, Resistance, and Moving Averages
For those focused on technical analysis, yesterday’s closing number is a critical data point. Traders look at where the Dow closed in relation to key psychological levels (such as 35,000 or 40,000) and moving averages (the average closing price over the last 50 or 200 days).
If the Dow closes above a long-standing “resistance” level, it may signal the start of a new bull market phase. If it closes below a “support” level, it could indicate further declines. By tracking these closing prices over time, investors can identify trends and patterns that help inform their entry and exit points in the market, making “yesterday’s close” an essential piece of the puzzle for short-term and long-term planning alike.
Factors That Drive the Dow’s Daily Fluctuations
To answer why the Dow closed where it did yesterday, one must examine the fundamental drivers of market volatility. The index does not move in a vacuum; it responds to a complex web of internal and external stimuli.

Economic Indicators and Federal Reserve Policy
Perhaps the most significant influence on the Dow’s closing price is the Federal Reserve’s monetary policy. Investors closely watch interest rate decisions and the “dot plot” forecasts. When the Fed signals a “hawkish” stance (rising interest rates to combat inflation), the Dow often closes lower because higher rates increase borrowing costs for corporations and can slow economic growth.
Additionally, monthly data releases—such as the Consumer Price Index (CPI), the Producer Price Index (PPI), and the non-farm payrolls report—act as catalysts. If yesterday’s close was significantly different from the day before, it was likely due to a reaction to one of these major economic data points.
Corporate Earnings and Global Geopolitical Events
Since the Dow only contains 30 stocks, the earnings reports of its individual members have a disproportionate effect on the index. If a heavyweight like Boeing or Caterpillar misses its quarterly earnings estimates, it can drag the entire index down, even if the other 29 stocks are performing well.
Furthermore, global events—such as trade negotiations, regional conflicts, or changes in foreign energy policy—can create sudden shifts in investor confidence. Because many Dow companies are multinational conglomerates, they are highly sensitive to currency fluctuations and international supply chain stability. Yesterday’s closing price is essentially the market’s real-time “vote” on how these global factors will impact future corporate profitability.
How to Track and Interpret Market Data in Real-Time
In the digital age, finding out what the Dow closed at is instantaneous. However, the challenge for the modern investor is not finding the data, but interpreting it without succumbing to “information overload.”
Digital Tools and Financial Platforms for Modern Investors
Platforms like Yahoo Finance, Bloomberg, and CNBC provide real-time updates and deep-dive analytics into the Dow’s performance. Many personal finance apps now allow users to set alerts for specific price movements. When checking yesterday’s close, it is helpful to look at the “heat map” of the Dow 30. This visual tool shows which specific sectors—technology, healthcare, or industrials—were the primary drivers of the day’s movement. Understanding which components led the charge helps investors see if a market rally was broad-based or driven by just one or two outliers.
Distinguishing Between Short-Term Volatility and Long-Term Trends
One of the greatest risks to personal finance is overreacting to a single day’s closing price. The market is inherently volatile, and “noise” is constant. A 300-point drop might seem alarming in a headline, but in a market where the Dow is over 35,000, that represents a move of less than 1%.
Smart investors use yesterday’s close as a reference point but keep their focus on the “rolling average.” By looking at weekly or monthly trends, you can filter out the daily fluctuations caused by algorithmic trading or temporary news cycles. This disciplined approach ensures that your long-term financial goals aren’t derailed by the “heartbeat” of the daily ticker.
Building a Resilient Investment Strategy Around Market Indices
Knowing what the Dow closed at yesterday is the start of a broader conversation about how you manage your wealth. While the DJIA is a famous benchmark, it is just one tool in a comprehensive financial toolkit.
The Role of Index Funds and ETFs
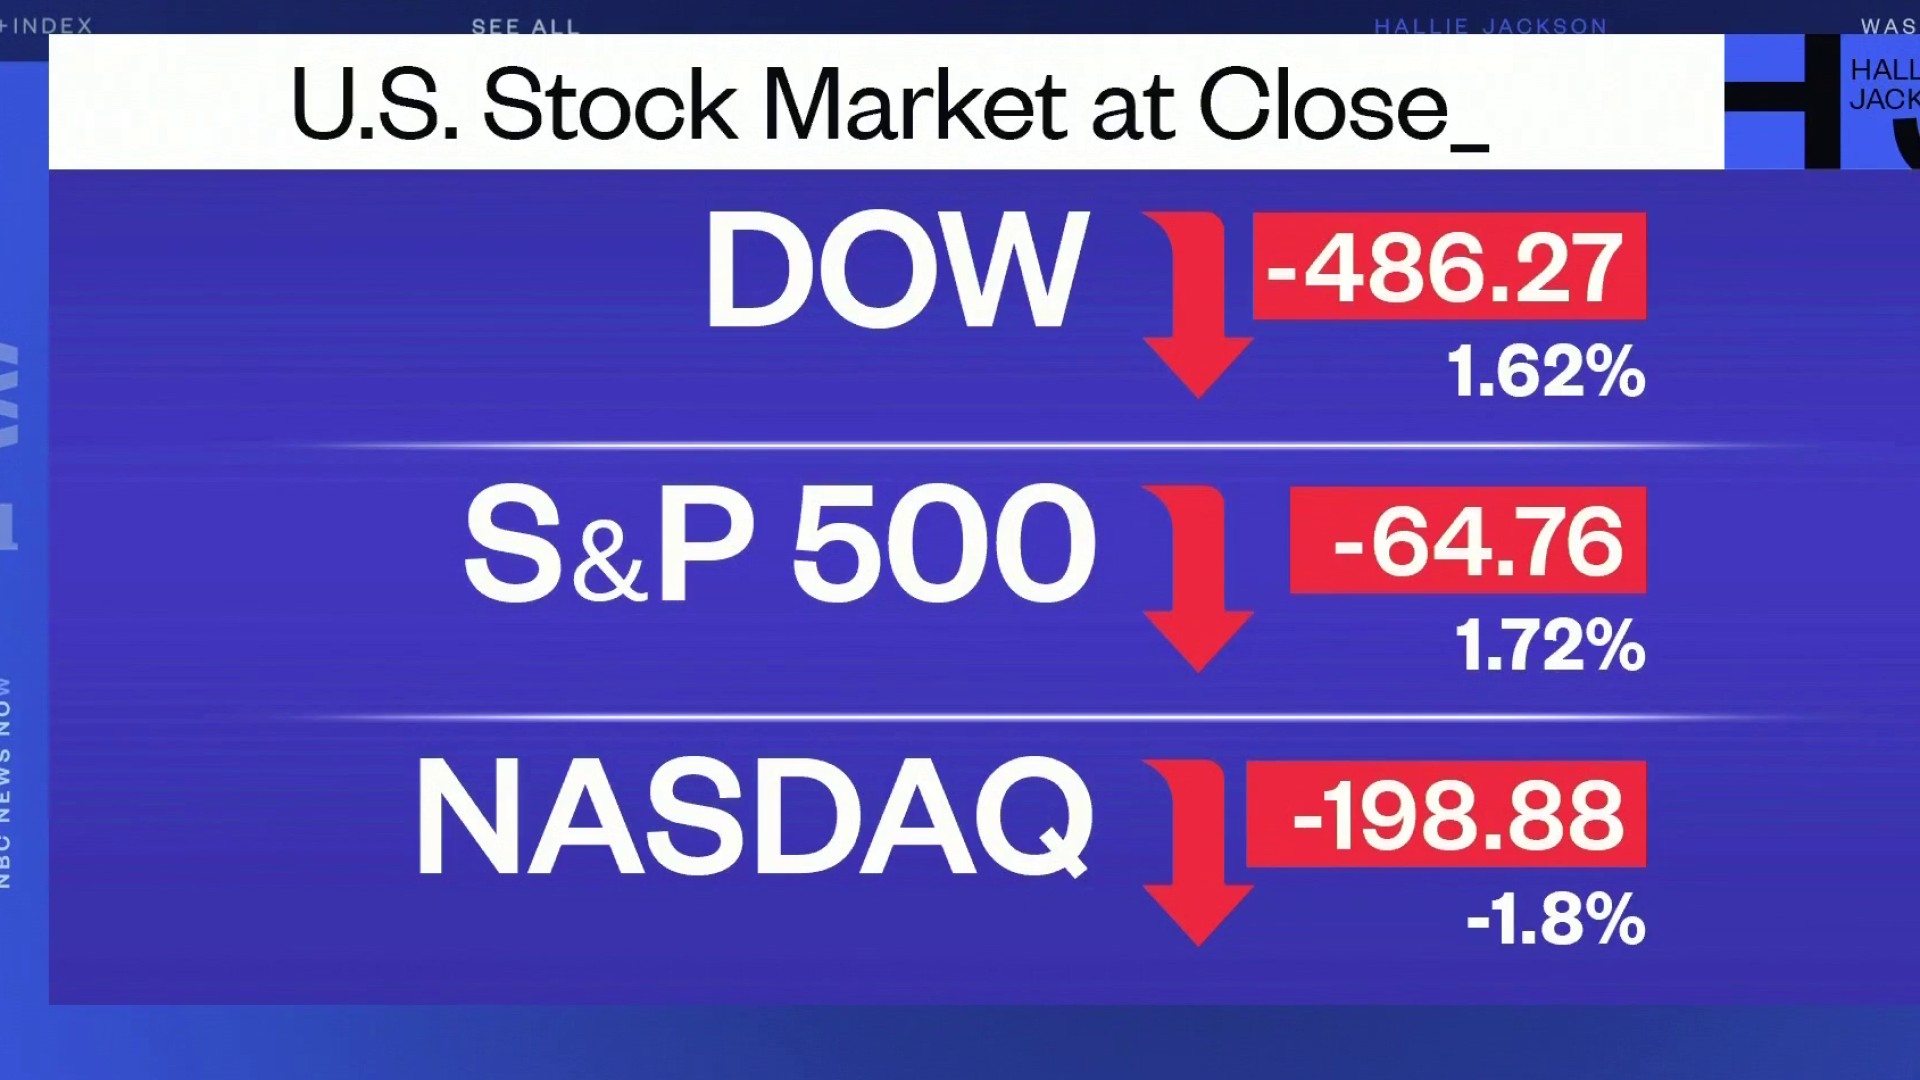
For many individuals, the best way to interact with the Dow is through passive investing. Exchange-Traded Funds (ETFs) that track the Dow Jones Industrial Average allow investors to own a piece of all 30 blue-chip companies through a single security. This provides instant diversification among the giants of the U.S. economy. Because these funds have low expense ratios, they are a staple of many retirement accounts and long-term investment portfolios. When the Dow closes higher, the value of these holdings increases proportionally, allowing investors to capture the growth of the American economy without having to pick individual winning stocks.
Diversification Beyond the 30 Blue-Chip Stocks
While the Dow is a prestigious index, relying on it exclusively can be a mistake. Because it only tracks 30 companies, it misses the growth of small-cap and mid-cap companies, as well as the international markets. A resilient financial strategy involves using the Dow as a barometer for large-cap U.S. stability while diversifying into other indices like the S&P 500 (for broader market exposure) or the Russell 2000 (for small-business exposure).
Ultimately, yesterday’s closing price of the Dow Jones is a historical record of a single day’s collective human and algorithmic judgment. By understanding its history, the mechanics of its calculation, and the factors that drive its movement, you can transform a simple “search query” into a sophisticated tool for building and protecting your financial future. Whether the Dow closed up or down yesterday, the most successful investors are those who understand the “why” behind the numbers and maintain a steady hand on the wheel of their long-term financial strategy.
aViewFromTheCave is a participant in the Amazon Services LLC Associates Program, an affiliate advertising program designed to provide a means for sites to earn advertising fees by advertising and linking to Amazon.com. Amazon, the Amazon logo, AmazonSupply, and the AmazonSupply logo are trademarks of Amazon.com, Inc. or its affiliates. As an Amazon Associate we earn affiliate commissions from qualifying purchases.