
When investors, news anchors, or casual observers ask, “How is the Dow doing?” they are usually looking for a shorthand pulse check on the American economy. The Dow Jones Industrial Average (DJIA), often referred to simply as “the Dow,” is the oldest and most recognized stock market index in the world. Despite the rise of more comprehensive indices like the S&P 500 or tech-heavy ones like the Nasdaq Composite, the Dow remains the primary benchmark for the general public.
Understanding how the Dow is doing requires more than just looking at a daily point fluctuation. It involves a deep dive into the methodology of the index, the macroeconomic factors currently driving the market, and the shifting landscape of the 30 “blue-chip” companies that comprise it. For anyone focused on personal finance and investing, interpreting the performance of the Dow is essential for long-term wealth management.
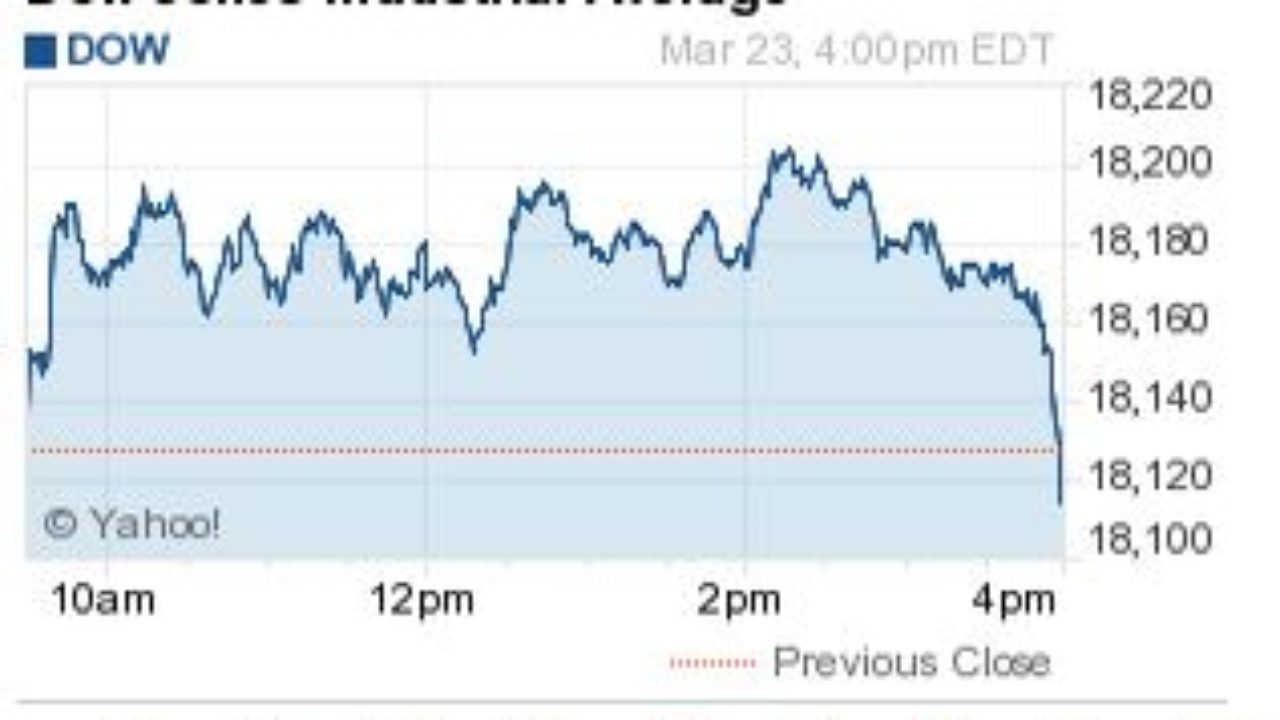
Understanding the Dow Jones Industrial Average (DJIA)
To accurately answer how the Dow is doing, one must first understand what the index actually represents. Created by Charles Dow in 1896, the index was originally intended to track the health of the industrial sector of the U.S. economy. Today, while it retains “Industrial” in its name, it covers a broad spectrum of industries, including healthcare, technology, finance, and consumer goods.
The History and Evolution of the Blue-Chip Index
The Dow began with only 12 companies, mostly involved in heavy industry like sugar, tobacco, and steel. General Electric was the longest-standing member until it was removed in 2018, signaling a massive shift in the American economic identity. The index now consists of 30 prominent, “blue-chip” companies listed on the New York Stock Exchange (NYSE) and the Nasdaq.
The selection process for these 30 companies is unique. Unlike other indices that follow strict quantitative rules, the Dow’s components are selected by a committee at S&P Dow Jones Indices. They look for companies with excellent reputations, sustained growth, and interest to a large number of investors. Because there are only 30 stocks, the Dow is a concentrated look at the leaders of the U.S. corporate world.
How the Dow is Calculated: The Price-Weighted Methodology
One of the most critical aspects of understanding “how the Dow is doing” is recognizing that it is a price-weighted index. This distinguishes it from the S&P 500, which is market-capitalization-weighted. In a price-weighted index, stocks with higher share prices have a greater influence on the index’s movements than those with lower share prices, regardless of the company’s actual size.
For example, a $1 move in a stock trading at $500 has the same impact on the Dow as a $1 move in a stock trading at $50. However, a 1% move in the $500 stock is much more significant to the index total than a 1% move in the $50 stock. To keep the index consistent after stock splits or changes in the 30-company lineup, the “Dow Divisor” is used. This mathematical constant ensures that structural changes in a company’s stock price do not lead to artificial jumps or drops in the index.
Key Factors Influencing the Dow’s Current Performance
The Dow does not move in a vacuum. Its performance is a reflection of a complex web of global events, monetary policy, and corporate health. When the Dow is “up,” it usually suggests a convergence of positive sentiment in several key areas.
Macroeconomic Indicators and Interest Rates
Perhaps the most significant driver of the Dow in the current era is the Federal Reserve’s monetary policy. Interest rates are the “gravity” of the financial markets. When interest rates are low, borrowing costs for companies decrease, leading to expansion and higher earnings. Conversely, when the Fed raises rates to combat inflation, the Dow often faces headwinds.
Investors watch the Federal Open Market Committee (FOMC) meetings with intense scrutiny. If the Fed signals a “hawkish” stance (higher rates), the Dow’s 30 components—many of which are capital-intensive industrial and financial giants—may see their stock prices under pressure. If the Fed is “dovish” (lower rates), the market often rallies as the cost of capital declines.
Corporate Earnings and Sector Rotations
Since the Dow consists of only 30 stocks, the quarterly earnings reports of companies like UnitedHealth Group, Goldman Sachs, and Microsoft have a disproportionate impact on the index. “Earnings season” is a pivotal time for determining how the Dow is doing. If these giants report strong revenue growth and healthy forward guidance, the Dow can climb even if the broader market is stagnant.
Furthermore, we often see “sector rotation” within the Dow. In periods of economic uncertainty, investors may flock to defensive Dow stocks like Procter & Gamble or Coca-Cola. In periods of high growth, they might rotate into the tech components like Apple or Salesforce. Monitoring these shifts helps investors understand whether the Dow’s performance is being driven by speculative growth or stable value.
Global Geopolitical Stability
As a collection of multinational corporations, the Dow is highly sensitive to international news. Trade tensions, wars, and global supply chain disruptions affect the “Industrial” part of the Dow significantly. Companies like Boeing or Caterpillar rely heavily on global trade; therefore, any friction in international relations is immediately reflected in the Dow’s daily points.

Interpreting “Doing Well”: Bull vs. Bear Markets
When we ask how the Dow is doing, we are often asking about market sentiment. Is the market in a state of optimism (Bull) or a state of pessimism (Bear)? Identifying these cycles is key to personal finance and deciding when to enter or exit a position.
Volatility and the Fear Factor (VIX)
A “green” day on the Dow doesn’t always mean the market is healthy. Sometimes, the index experiences high volatility—swinging hundreds of points in both directions within hours. Professional investors often look at the CBOE Volatility Index (VIX) alongside the Dow. If the Dow is rising but the VIX is also high, it suggests that the “doing well” might be a temporary bounce in a broader sea of instability.
Understanding volatility helps investors avoid the emotional trap of panic selling. The Dow has survived world wars, depressions, and pandemics. Seeing a 500-point drop in a single day is jarring, but in the context of a 35,000+ point index, it is a relatively small percentage move compared to the crashes of the 20th century.
Long-term Growth vs. Short-term Fluctuations
From a wealth-building perspective, how the Dow is doing today is rarely as important as how it is doing over a ten-year horizon. Historically, the Dow has trended upward, rewarding patient investors. The “points” are a psychological benchmark. Crossing milestones like 30,000 or 40,000 creates a media frenzy and boosts investor confidence, but the underlying percentage growth is what dictates the actual return on an investment portfolio.
The Role of the Dow in a Modern Investment Strategy
For the individual investor, the Dow is more than just a headline; it is an investable asset. Whether through mutual funds or Exchange-Traded Funds (ETFs), the Dow plays a specific role in asset allocation.
Dow vs. S&P 500: Which One Matters More?
Many financial advisors argue that the S&P 500 is a better representation of the “market” because it includes 500 companies and uses market-cap weighting. However, the Dow remains relevant because it focuses on “quality.” The companies in the Dow are typically profitable, dividend-paying entities with long histories.
If you are a value-oriented investor looking for stability and dividends, you might care more about how the Dow is doing. If you are a growth-oriented investor focused on the total breadth of the U.S. economy, the S&P 500 or the Nasdaq might be your primary guide.
How to Invest in the Dow
You cannot “buy” the Dow Jones Industrial Average directly because it is a mathematical index. However, you can buy financial products that mirror its performance. The most famous is the SPDR Dow Jones Industrial Average ETF Trust (ticker: DIA), often called “Diamonds.”
Investing in the Dow via an ETF provides instant diversification across 30 of the world’s most successful companies. It is often considered a “safer” equity play compared to small-cap stocks or individual tech startups, as the Dow components are “too big to fail” in many economic contexts.
The Future Outlook for the Industrial Average
As we look toward the future of the American economy, the question of “how the Dow is doing” will continue to evolve. The index is increasingly being forced to reconcile its “Industrial” roots with the reality of a service- and tech-based digital economy.
Transitioning to a Digital Economy
In recent years, the Dow has added more technology-centric companies to remain relevant. The inclusion of Amazon and the continued weight of Microsoft and Apple show that even the old-school Dow is acknowledging that “industry” now involves cloud computing and e-commerce as much as it involves factories and railroads.
This transition means the Dow is becoming more correlated with the Nasdaq than it used to be. For investors, this means the Dow might offer slightly more growth potential than in the past, but it also means it may carry more of the volatility associated with the tech sector.
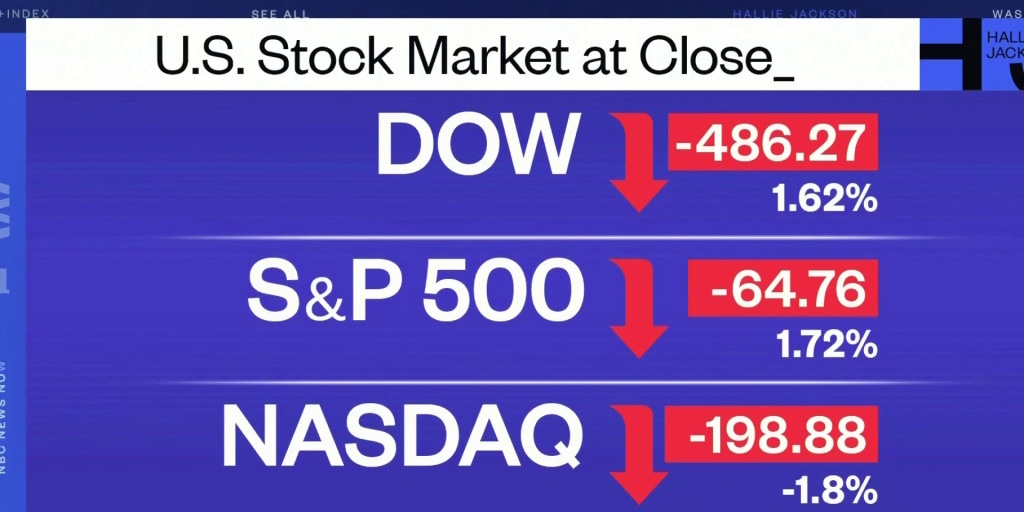
Conclusion: Looking Beyond the Points
Ultimately, “how the Dow is doing” is a question with many layers. On the surface, it’s a number that tells us if stock prices for the 30 largest companies rose or fell. Beneath the surface, it is a story of corporate earnings, federal policy, and global sentiment.
For the savvy investor, the Dow is a tool—a barometer for the health of established American capitalism. By looking past the daily point swings and focusing on the underlying economic drivers, you can gain a clearer picture of the financial landscape and make more informed decisions for your personal financial future. Whether the Dow is at a record high or in the midst of a correction, its long-term trajectory remains one of the most powerful indicators of wealth creation in the modern world.
aViewFromTheCave is a participant in the Amazon Services LLC Associates Program, an affiliate advertising program designed to provide a means for sites to earn advertising fees by advertising and linking to Amazon.com. Amazon, the Amazon logo, AmazonSupply, and the AmazonSupply logo are trademarks of Amazon.com, Inc. or its affiliates. As an Amazon Associate we earn affiliate commissions from qualifying purchases.