The Standard & Poor’s 500, or simply the S&P 500, is arguably the most watched financial metric in the world. When investors, economists, and news anchors ask, “What is the market doing today?” they are almost always referring to this index. Comprising 500 of the largest publicly traded companies in the United States, it represents approximately 80% of the total market capitalization of the U.S. equity market. Understanding its daily movement is not just about watching numbers change on a screen; it is about interpreting the collective sentiment of global investors and the health of the American economy.
In this guide, we will explore the mechanisms that drive the S&P 500’s daily performance, the tools used to track it, and how investors can distinguish between short-term noise and long-term financial signals.
Deciphering the Daily Pulse: Factors Driving Today’s Market
The daily movement of the S&P 500 is a reaction to a constant stream of information. Markets are efficient processors of data, and any “new” information—whether positive or negative—is instantly priced into the index. To understand what the S&P 500 is doing today, one must look at the specific catalysts that influence buyer and seller behavior.
The Role of Macroeconomic Indicators
Macroeconomic data releases are often the primary drivers of intraday volatility. The “Big Three” reports that investors watch are the Consumer Price Index (CPI), the Non-Farm Payrolls (NFP) report, and Gross Domestic Product (GDP) updates. For example, if the CPI shows that inflation is cooling faster than expected, the S&P 500 often rallies as investors anticipate that the Federal Reserve might lower interest rates. Conversely, a “hot” jobs report might cause the index to dip, as it suggests the economy is overheating, potentially leading to prolonged high interest rates.
Federal Reserve Policy and Interest Rates
The Federal Reserve’s Federal Open Market Committee (FOMC) meetings are perhaps the most critical events for the S&P 500. Interest rates are the “gravity” of the financial world. When rates rise, the present value of future corporate earnings decreases, making stocks less attractive compared to fixed-income assets like bonds. On days when the Fed chair speaks, the S&P 500 can experience significant swings based on “hawkish” (favoring high rates) or “dovish” (favoring low rates) rhetoric.
Corporate Earnings Seasons
Four times a year, the companies within the S&P 500 report their quarterly financial results. Because the index is market-capitalization-weighted, the performance of “Mega-Cap” companies—such as Apple, Microsoft, and Nvidia—has a disproportionate effect on the index’s daily movement. If a major tech giant beats earnings expectations and provides strong forward guidance, it can pull the entire index upward, even if hundreds of smaller companies in the index are trading lower.
The Influence of Sector Performance and Market Weighting
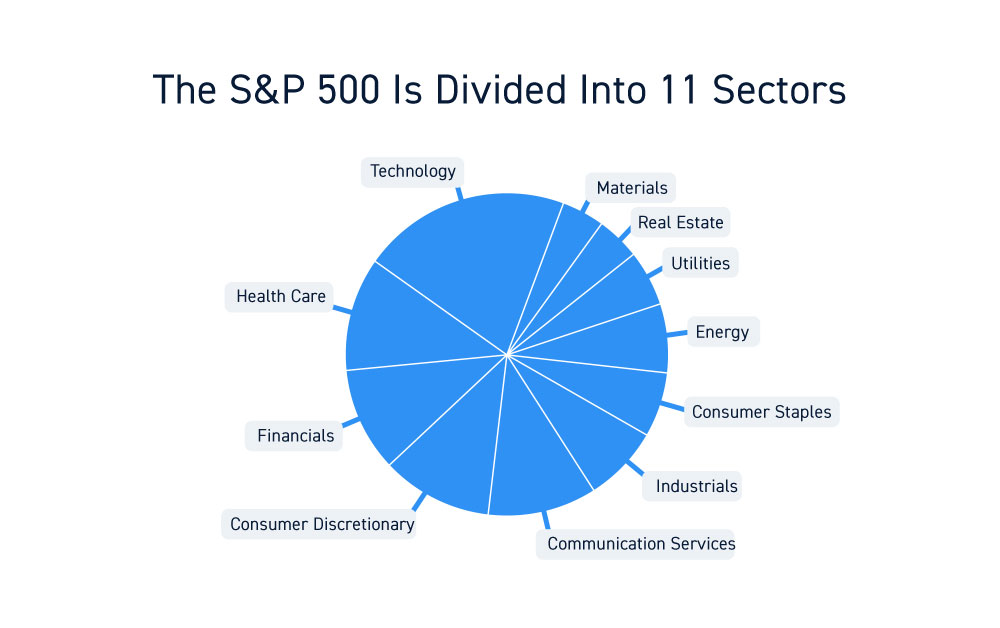
To truly understand what the S&P 500 is doing today, you must look beneath the surface. The index is divided into 11 GICS (Global Industry Classification Standard) sectors. Often, the S&P 500 may appear flat, but a “rotation” is occurring where investors are moving money out of one sector and into another.
The Dominance of Technology and Growth Stocks
In the modern era, the Information Technology and Communication Services sectors make up a massive portion of the S&P 500. This concentration means that the “today” of the S&P 500 is often dictated by the “today” of Silicon Valley. When growth stocks are in favor, the index tends to soar. However, this also introduces concentration risk. If a regulatory hurdle hits the tech sector, the S&P 500 can struggle even if the “Old Economy” sectors like Industrials or Materials are performing well.
Defensive vs. Cyclical Sectors
On days of economic uncertainty, you will often see a divergence in sector performance. Defensive sectors, such as Consumer Staples, Utilities, and Healthcare, tend to hold steady or rise when the broader market is falling because these companies provide essential services that people need regardless of the economy. Cyclical sectors, such as Financials and Consumer Discretionary, move in tandem with the economic cycle. Observing which sectors are leading the day provides a clear picture of whether the market is in a “risk-on” or “risk-off” mood.
The Impact of Geopolitics and Global Events
The S&P 500 does not exist in a vacuum. Because many of its constituent companies are multinationals, global events—ranging from oil price fluctuations in the Middle East to trade policy shifts in Asia—can impact the index’s daily opening price. “Gap openings,” where the index starts the day significantly higher or lower than it closed the previous day, are often the result of news that broke while the U.S. markets were closed.
Essential Tools and Metrics for Real-Time Monitoring
For the modern investor, tracking the S&P 500 goes beyond looking at a single price point. Several sophisticated tools and secondary metrics provide context to what the index is doing at any given moment.
Real-Time Financial Dashboards and Terminals
Professional traders use Bloomberg Terminals or Reuters Eikon for millisecond-accurate data. However, retail investors have access to powerful free tools like Yahoo Finance, Google Finance, and TradingView. These platforms allow users to view “Heat Maps,” which provide a visual representation of the S&P 500 where the size of a company’s box represents its market weight and the color represents its daily gain or loss. A sea of red indicates a broad sell-off, while a map dominated by green indicates widespread optimism.
The VIX: The Market’s “Fear Gauge”
To understand the quality of the S&P 500’s movement today, one should look at the CBOE Volatility Index (VIX). The VIX measures the market’s expectation of 30-day volatility based on S&P 500 index options. If the S&P 500 is down and the VIX is spiking, it indicates panic or hedging activity. If the index is drifting lower while the VIX remains low, it suggests a calm, orderly pullback rather than a systemic crash.
Advance-Decline Lines and Market Breadth
Market “breadth” refers to how many stocks are participating in a move. If the S&P 500 is up 1% today, but only 50 stocks are rising while 450 are falling, the move is considered “thin” and potentially unsustainable. Analysts use the Advance-Decline Line (A/D Line) to see if the majority of stocks are moving in the same direction as the index. Strong market days are characterized by “broad-based” rallies where most sectors and stocks participate in the gains.
Strategic Responses: Navigating Daily Volatility for Long-Term Wealth
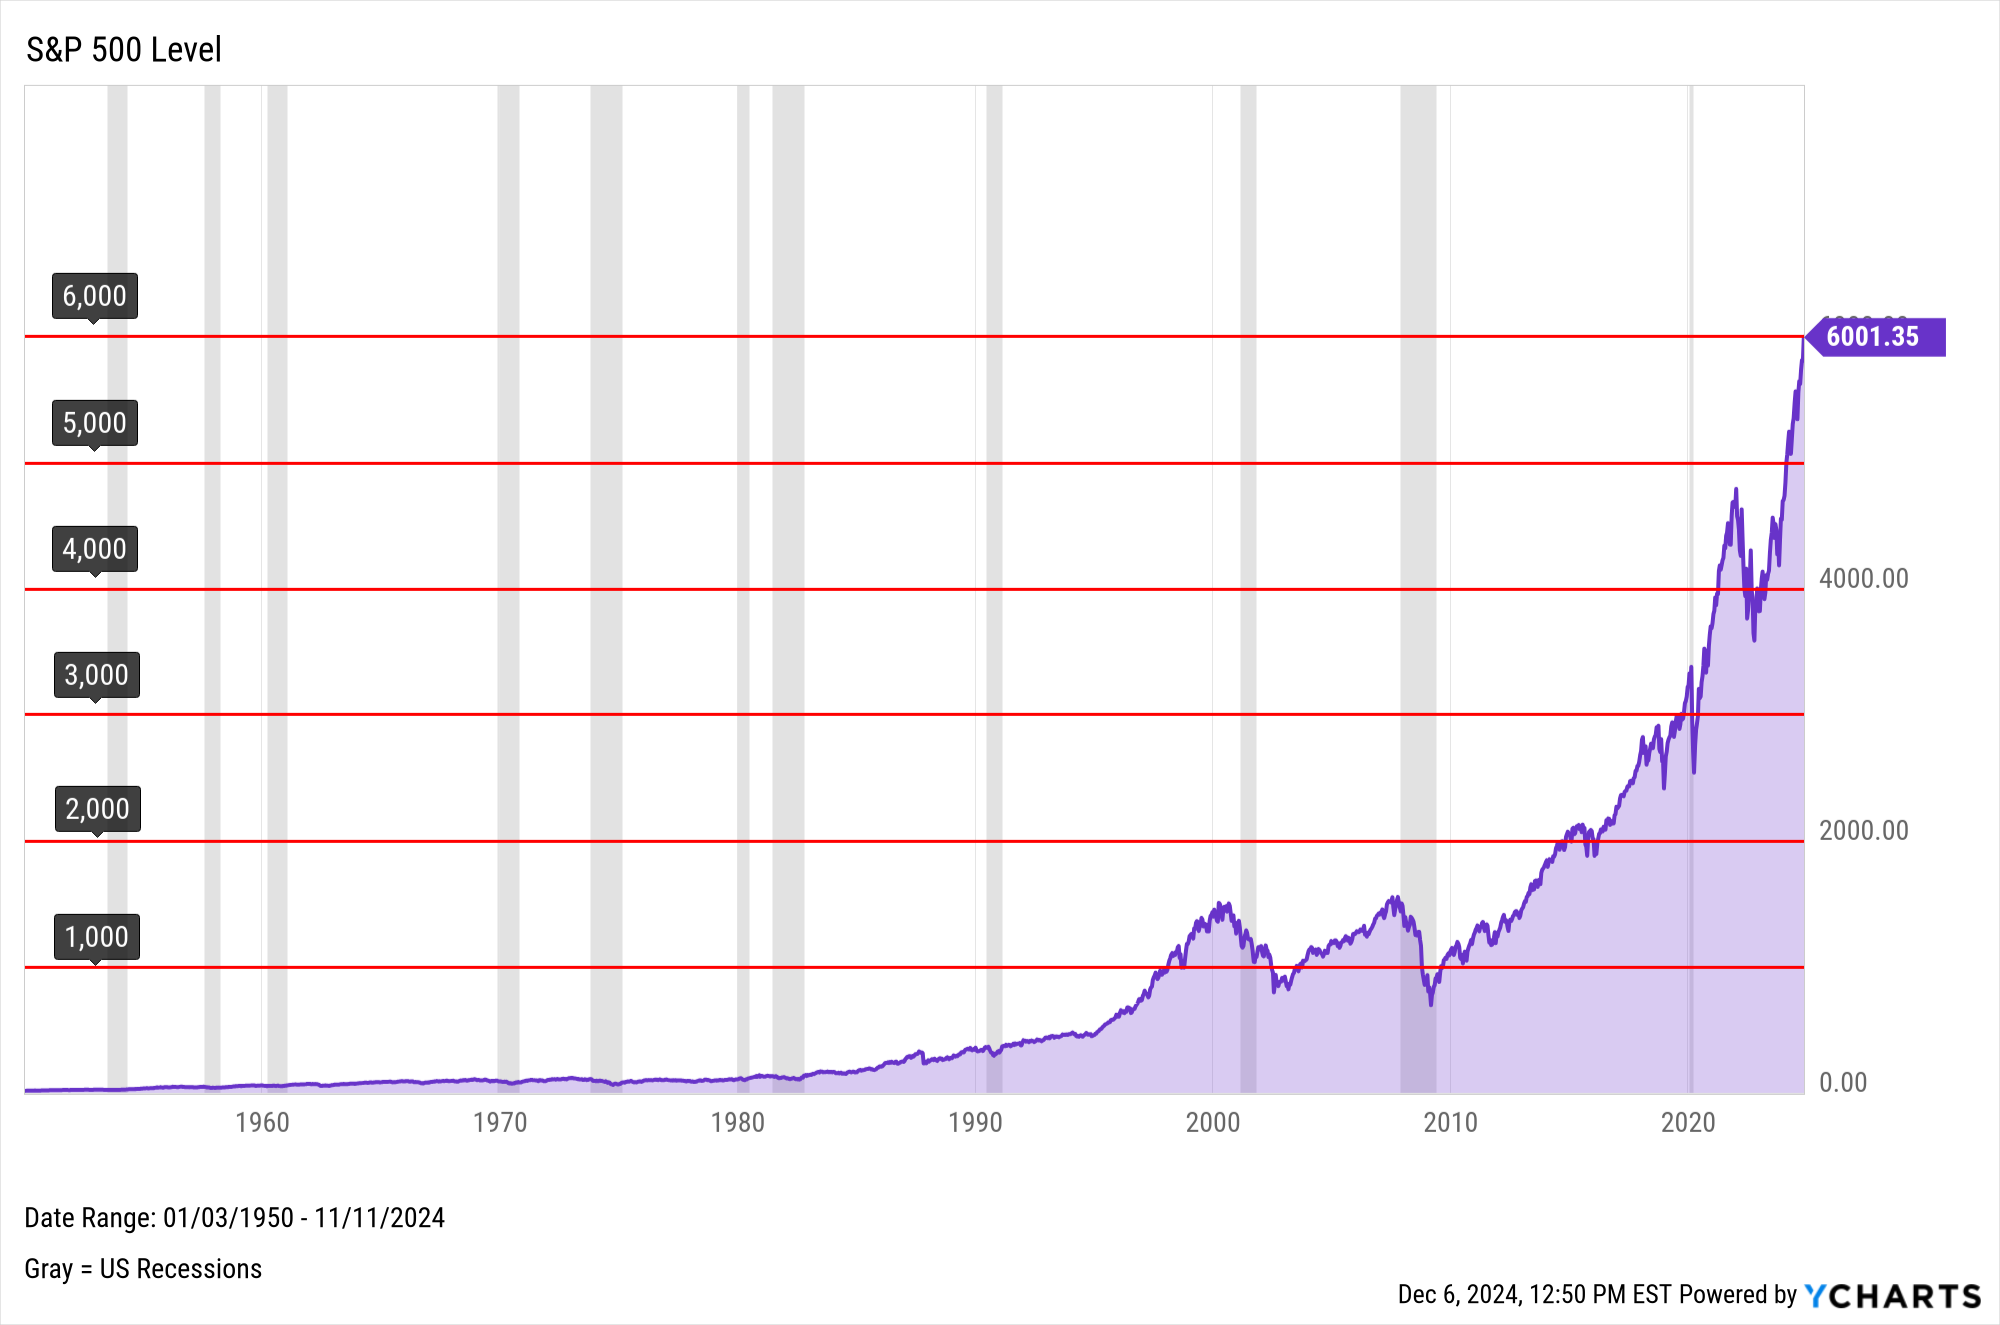
While it is fascinating to track what the S&P 500 is doing today, the most successful investors understand how to use this information without falling prey to emotional trading. The daily fluctuations of the market are often referred to as “noise,” while the long-term upward trajectory is the “signal.”
Distinguishing Between Volatility and Risk
Volatility is the frequency and magnitude of price swings. Risk is the potential for permanent loss of capital. A 2% drop in the S&P 500 today is volatility, not necessarily risk. For a long-term investor, daily dips can actually be viewed as opportunities. Developing a “watchlist” of high-quality S&P 500 ETFs or individual stocks allows an investor to capitalize on days when the market overreacts to temporary bad news.
The Power of Dollar-Cost Averaging (DCA)
One of the best ways to handle the question of “what the market is doing today” is to make the answer irrelevant to your execution. Dollar-cost averaging involves investing a fixed amount of money at regular intervals, regardless of the index’s price. When the S&P 500 is “doing poorly” (prices are low), your fixed investment buys more shares. When the index is “doing great” (prices are high), you buy fewer shares. Over time, this strategy lowers your average cost per share and removes the stress of trying to time the daily peaks and valleys.

Maintaining a Diversified Portfolio
Even though the S&P 500 is diversified across 500 companies, it is still a single asset class (U.S. Large-Cap Stocks). On days when the S&P 500 is struggling, other areas of a well-balanced portfolio—such as international stocks, small-cap stocks, bonds, or real estate—may be performing better. Understanding the daily movement of the S&P 500 should be part of a broader financial strategy that looks at your total net worth rather than a single index.
In conclusion, “what the S&P 500 is doing today” is a snapshot of global economic health, investor sentiment, and corporate profitability. By understanding the macroeconomic catalysts, sector dynamics, and technical tools available, you can move from being a passive observer to an informed participant in the financial markets. Whether the index is up or down today, the key to financial success remains a disciplined approach, a focus on fundamentals, and the perspective to look beyond the daily ticker.
aViewFromTheCave is a participant in the Amazon Services LLC Associates Program, an affiliate advertising program designed to provide a means for sites to earn advertising fees by advertising and linking to Amazon.com. Amazon, the Amazon logo, AmazonSupply, and the AmazonSupply logo are trademarks of Amazon.com, Inc. or its affiliates. As an Amazon Associate we earn affiliate commissions from qualifying purchases.