
In the world of finance and investing, the difference between a successful portfolio and a failing one often boils down to a single skill: the ability to distinguish between signal and noise. To the untrained eye, the movement of the stock market, the fluctuation of currency pairs, or the volatility of commodities looks like chaotic randomness. However, seasoned investors and professional traders view these movements through a different lens. To them, the market is a constant stream of data, and within that data lie “signals”—actionable pieces of information that suggest a specific course of action.
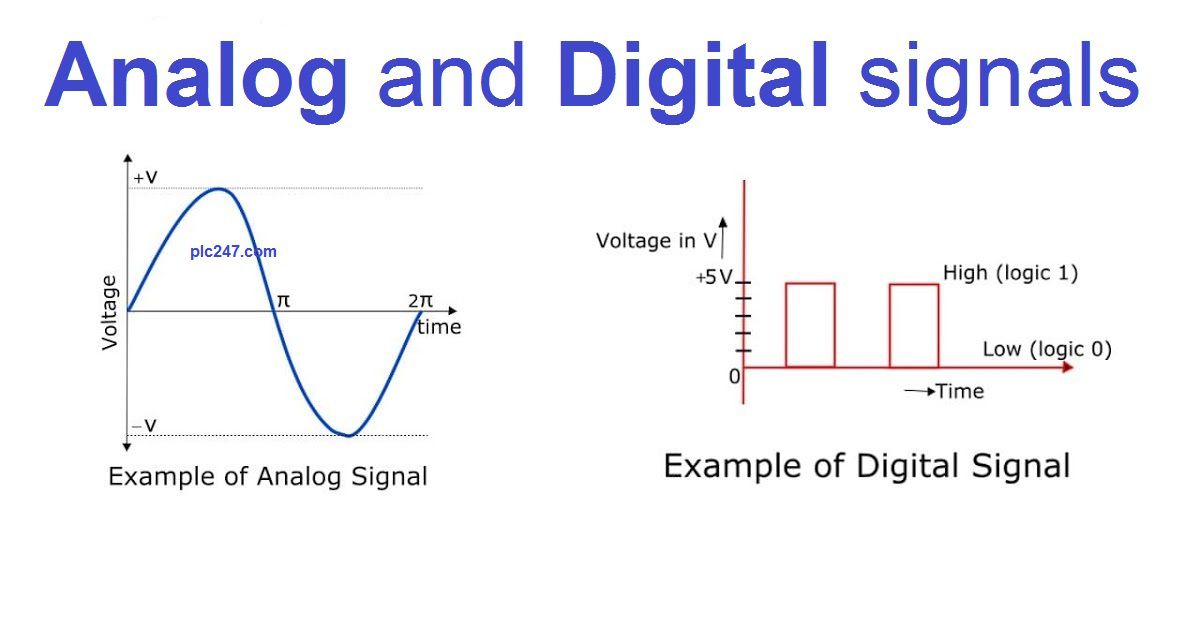
A signal, in the context of money and investing, is essentially a trigger. It is a calculated indicator based on historical data, mathematical models, or fundamental shifts that suggests it is time to buy, sell, or hold an asset. Understanding what signals are and how to interpret them is the cornerstone of modern financial strategy.
The Core Concept: Defining Financial Signals
At its most basic level, a financial signal is a piece of information that provides insight into the future direction of an asset’s price. While no signal is a guarantee of future performance, they provide a probabilistic advantage, allowing investors to move away from guesswork and toward a systematic approach to wealth building.
The Anatomy of a Market Signal
A signal typically consists of three components: the data source, the logic or “filter” applied to that data, and the resulting action. For example, if the data source is the daily closing price of a stock, and the logic is that the price has dropped 10% below its average over the last 50 days, the resulting signal might be a “buy” recommendation.
Signals can be generated manually by analysts studying spreadsheets or automatically by complex algorithms scanning thousands of data points per second. Regardless of the method, the goal remains the same: to identify a pattern or condition that historically precedes a profitable move.
Objective Data vs. Subjective Interpretation
The power of a signal lies in its objectivity. In the high-stakes world of investing, human emotions—specifically fear and greed—are the primary drivers of poor decision-making. Signals act as an emotional circuit breaker. By following a predetermined set of signals, an investor can remove the psychological pressure of “guessing” what the market will do.
However, it is important to note that while the signal itself might be objective (e.g., “the price has crossed the 200-day moving average”), the choice of which signals to follow remains a subjective strategy. Successful investors spend years refining which signals they trust and which they ignore as “noise.”
Technical Signals: Navigating the Charts
Technical signals are perhaps the most well-known category in the trading community. These signals are derived from technical analysis—the study of past market data, primarily price and volume. Technical analysts believe that all known information about an asset is already reflected in its price, and therefore, the price chart itself is the only signal needed.
Moving Averages and Trend Indicators
One of the most foundational signals is the Moving Average (MA). By smoothing out price data over a specific period, the MA helps investors identify the underlying trend.
A “Golden Cross” is a classic bullish signal that occurs when a short-term moving average (like the 50-day) crosses above a long-term moving average (like the 200-day). Conversely, a “Death Cross” occurs when the short-term average falls below the long-term average, signaling a potential bear market. These signals are used by both retail traders and institutional funds to time their entries and exits into major market indices.
Momentum Oscillators and Volume Cues
Beyond simple trends, traders look for signals of momentum. Indicators like the Relative Strength Index (RSI) provide signals based on whether an asset is “overbought” or “oversold.” If the RSI signal moves above 70, it suggests the asset may be overextended and due for a correction (a sell signal). If it drops below 30, it suggests the asset is undervalued (a buy signal).
Volume serves as a confirmation signal. If a price moves upward on high trading volume, the signal is considered strong because it indicates high conviction among market participants. If the price rises on low volume, the signal is weak, suggesting the move may be a “head-fake” or a temporary anomaly.
Chart Patterns as Predictive Signals
The visual representation of price action often forms repeatable patterns that act as signals. Patterns such as “Head and Shoulders,” “Double Bottoms,” or “Cup and Handle” are not just shapes on a graph; they are psychological signatures of market participants. For instance, a “Breakout” signal occurs when a price moves above a defined level of resistance, signaling that the bulls have taken control and the price is likely to continue its upward trajectory.
Fundamental and Sentiment Signals: The Macro View
While technical signals focus on what the price is doing, fundamental signals focus on why the price should be moving. These signals are rooted in the economic reality of the asset, whether it is a company’s balance sheet or a nation’s interest rate policy.
Economic Indicators and Policy Shifts
Macroeconomic signals are the “big picture” cues that drive long-term investment shifts. The most potent signals in this category come from central banks, such as the Federal Reserve. An announcement of an interest rate hike is a signal that the cost of borrowing is increasing, which typically acts as a bearish signal for stocks but a bullish signal for the currency.
Other vital macro signals include Gross Domestic Product (GDP) growth rates, unemployment data, and Consumer Price Index (CPI) readings. For a value investor, a signal might be as simple as identifying a country with a high growth rate but an undervalued currency.
Corporate Earnings and “Noise” vs. Signal
For stock investors, quarterly earnings reports are the ultimate signaling events. A signal here isn’t just the “headline” number of how much profit a company made; it’s the nuance within the report. A “positive earnings surprise”—where a company beats analyst expectations—is a strong buy signal.
However, the true signal often lies in the “guidance”—what the CEO says about the next six months. If a company posts record profits but issues a “downbeat guidance,” the market often treats it as a sell signal, anticipating future trouble that isn’t yet reflected in the current price.
Social Sentiment and Retail Crowdsourcing
In the digital age, a new category of signals has emerged: Sentiment Signals. By analyzing social media trends, search engine volume, and “fear and greed” indices, investors can gauge the collective mood of the market.
A “contrarian signal” occurs when sentiment becomes extremely one-sided. For example, if everyone on social media is euphoric about a specific cryptocurrency, a professional investor might see this as a signal that the market is at a peak and a crash is imminent. In this case, extreme “noise” actually becomes a valuable “signal” for the disciplined investor.
Algorithmic and AI-Driven Signaling in the Modern Era
The landscape of financial signaling has been transformed by technology. Today, a significant portion of market volume is driven by algorithms that process signals at speeds impossible for a human brain.
Quantitative Analysis and High-Frequency Signals
Quantitative (or “quant”) funds use mathematical models to find signals in massive datasets. These might include signals derived from historical correlations—such as the price of oil historically signaling a move in airline stocks. High-frequency trading (HFT) systems look for “micro-signals,” such as a slight discrepancy in the price of a stock across two different exchanges, executing trades in milliseconds to capture a fraction of a cent in profit.
Machine Learning in Signal Refinement
Artificial Intelligence and Machine Learning (ML) have taken signaling to the next level. Traditional signals are “static”—the rules don’t change. ML-driven signals are “dynamic.” These systems can learn from past mistakes, refining their logic as market conditions evolve.
For example, an AI might discover that a specific technical signal works perfectly during periods of low inflation but fails during high inflation. It will then automatically adjust its signaling criteria based on the current inflationary environment. This level of sophistication allows for “multi-factor signals,” where dozens of different data points are synthesized into a single probability score.
Best Practices for Implementing Signal-Based Strategies
Identifying a signal is only half the battle; the other half is knowing how to execute it within a broader financial framework.
Managing Risk and Avoiding False Positives
The greatest danger in signal-based investing is the “false positive” or “whipsaw.” This happens when a signal indicates a move, the investor enters the market, and then the market immediately reverses.
To combat this, professional investors use “confirmation.” They rarely trade on a single signal. Instead, they look for “confluence”—a situation where multiple signals align. For example, an investor might only buy a stock if it has a positive fundamental earnings report (Fundamental Signal) AND its price crosses a key moving average (Technical Signal).
Building a Multi-Factor Signaling System
A robust financial plan relies on a diverse set of signals across different timeframes and asset classes. By building a system that balances short-term technical signals with long-term fundamental cues, an investor can create a “weather map” for their money.
Ultimately, signals are about increasing the “signal-to-noise ratio” in your financial life. In an era of information overload, the most successful individuals aren’t those who have the most information, but those who have the best filters. By mastering the art of the signal, you can move through the markets with clarity, confidence, and a systematic approach to building lasting wealth.
aViewFromTheCave is a participant in the Amazon Services LLC Associates Program, an affiliate advertising program designed to provide a means for sites to earn advertising fees by advertising and linking to Amazon.com. Amazon, the Amazon logo, AmazonSupply, and the AmazonSupply logo are trademarks of Amazon.com, Inc. or its affiliates. As an Amazon Associate we earn affiliate commissions from qualifying purchases.