
In the intricate world of finance, where every decision can have profound implications, understanding the underlying mechanics is paramount. Investors, analysts, and financial professionals constantly seek tools and metrics to cut through the noise, quantify risk, and project potential returns. Among these indispensable tools, “coefficients” stand out as fundamental building blocks. Far from being mere abstract mathematical constructs, coefficients are the bedrock upon which much of modern financial analysis is built. They provide a concise, quantifiable measure of relationships, sensitivities, and performance, empowering smarter, data-driven decisions.
The question, “What’s the coefficient?” isn’t just a quest for a definition; it’s an inquiry into the very heart of financial modeling and strategic planning. Whether assessing a stock’s volatility relative to the market, optimizing a portfolio for diversification, or evaluating a fund manager’s skill, coefficients offer invaluable clarity. This article will delve into the most critical coefficients in the financial landscape, explaining their meaning, calculation, practical application, and limitations, ultimately equipping you with a deeper understanding of their power to unlock superior financial insights.

Decoding the Numbers: The Ubiquity of Coefficients in Finance
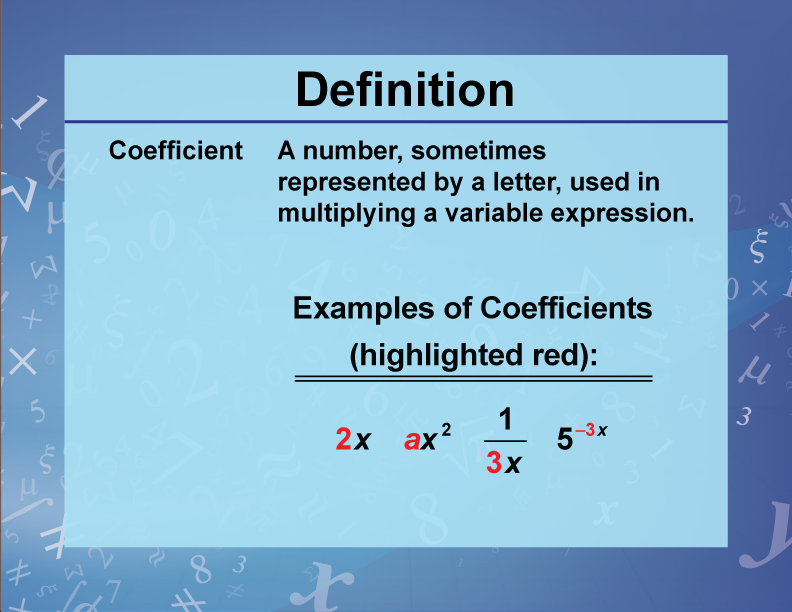
At its core, a coefficient is a numerical factor that multiplies a variable or quantifies a specific property or relationship. In finance, this translates into measures that help us understand how different assets, markets, or economic factors interact and perform. These numbers condense complex realities into digestible metrics, enabling comparisons, predictions, and risk assessments. Without them, financial analysis would devolve into mere guesswork, lacking the precision and empirical backing necessary for informed decision-making.
From Theory to Practice: Why Coefficients Matter
The practical importance of coefficients cannot be overstated. They transform qualitative observations into quantitative data, allowing for objective analysis. For instance, rather than vaguely stating that a stock is “volatile,” a coefficient provides an exact measure of its historical price fluctuations relative to a benchmark. This allows investors to compare different stocks objectively, understand their risk profiles, and incorporate them effectively into a diversified portfolio. Coefficients are the bridge between raw data and actionable intelligence, informing everything from individual stock selection to macro-economic policy formulation. They help us answer critical questions: How much risk am I taking? How diversified is my portfolio? Is this investment truly outperforming the market, or is it just riding a wave?
The Language of Financial Mathematics
To truly speak the language of finance, one must understand its mathematical grammar, and coefficients are key vocabulary words. They are derived from statistical models, historical data analysis, and economic theories. While the underlying calculations can sometimes be complex, the interpretation of the resulting coefficients is designed to be straightforward, even for those without advanced mathematical degrees. The power lies in their ability to summarize intricate financial phenomena into a single, often intuitive, number. Mastering these coefficients means gaining a critical edge in navigating the financial markets and making more astute financial decisions.
Beta: Your Compass for Market Volatility and Risk
Among all financial coefficients, Beta (β) is arguably the most widely recognized and frequently used, particularly in the realm of equity investing. It serves as a crucial measure of an asset’s or a portfolio’s sensitivity to movements in the overall market. In essence, Beta tells you how much an investment’s price is expected to move relative to a market benchmark, such as the S&P 500.
Calculating and Interpreting Beta
Beta is calculated using regression analysis, comparing the historical price movements of an asset to those of a chosen market index. The formula generally involves the covariance between the asset’s returns and the market’s returns, divided by the variance of the market’s returns.
Here’s how to interpret its value:
- Beta of 1.0: The asset’s price tends to move in lockstep with the market. If the market goes up by 10%, the asset is expected to go up by 10%.
- Beta greater than 1.0 (e.g., 1.5): The asset is more volatile than the market. If the market goes up by 10%, the asset is expected to go up by 15% (and down by 15% if the market falls). These are typically aggressive growth stocks.
- Beta less than 1.0 (e.g., 0.5): The asset is less volatile than the market. If the market goes up by 10%, the asset is expected to go up by 5%. These are often defensive stocks like utilities or consumer staples.
- Beta of 0: The asset’s price movements are uncorrelated with the market.
- Negative Beta (e.g., -0.5): The asset tends to move in the opposite direction to the market. While rare, some inverse ETFs or specific hedges can exhibit negative Beta.
Practical Applications for Investors
Beta is a cornerstone of the Capital Asset Pricing Model (CAPM), which calculates the expected return of an asset based on its Beta, the risk-free rate, and the market risk premium. For investors, Beta is incredibly practical:
- Risk Assessment: It helps quantify systemic risk—the risk inherent in the overall market, which cannot be diversified away. A high Beta stock carries more systemic risk.
- Portfolio Management: Investors can use Beta to tailor their portfolio’s overall risk profile. To reduce market risk, one might add lower Beta stocks. To increase potential returns (and risk), higher Beta stocks could be included.
- Strategic Allocation: Understanding the Beta of various sectors or asset classes can inform strategic asset allocation decisions, especially in anticipation of different market conditions (bull vs. bear markets).
Limitations and Nuances of Beta
While powerful, Beta is not without its limitations. It is a historical measure, meaning past volatility might not predict future performance accurately, especially during periods of significant market shifts or company-specific events. Beta is also often calculated using different look-back periods (e.g., 3-year or 5-year), which can yield different values. Furthermore, Beta only captures market-related risk and does not account for company-specific (unsystematic) risks that can be diversified away. Therefore, Beta should always be used in conjunction with other analytical tools and qualitative assessments.
The Power of Correlation: Building Resilient Portfolios
Beyond understanding how individual assets move relative to the market, a critical aspect of portfolio construction is understanding how assets move relative to each other. This is where the correlation coefficient comes into play. Correlation measures the degree to which two assets’ prices move in tandem. It is a vital tool for achieving portfolio diversification, a strategy designed to reduce risk by combining a variety of investments.
Understanding Positive, Negative, and Zero Correlation
The correlation coefficient ranges from -1.0 to +1.0:
- +1.0 (Perfect Positive Correlation): The two assets move in the exact same direction and magnitude. If one goes up by 5%, the other also goes up by 5%. Investing in two perfectly positively correlated assets offers no diversification benefits.
- -1.0 (Perfect Negative Correlation): The two assets move in exactly opposite directions and magnitude. If one goes up by 5%, the other goes down by 5%. This is the ideal scenario for diversification, as losses in one asset could be offset by gains in the other.
- 0 (Zero Correlation): The movements of the two assets are completely independent of each other. While not offering perfect hedging, zero correlation still provides significant diversification benefits compared to positive correlation.
- Values between -1.0 and +1.0: Most assets exhibit some degree of positive correlation (e.g., +0.7), meaning they generally move in the same direction but not always with the same magnitude.
Diversification Through Correlation Analysis
The primary application of correlation in finance is to enhance portfolio diversification. By combining assets that have low or negative correlation with each other, investors can reduce the overall risk of their portfolio without necessarily sacrificing returns. The idea is that when one asset performs poorly, another asset in the portfolio might perform well, thereby dampening the portfolio’s overall volatility.
For example, a portfolio solely invested in technology stocks would likely be highly positively correlated and susceptible to sector-specific downturns. Adding assets like real estate, bonds, or commodities, which historically have lower correlations with equities, can help smooth out portfolio returns during market fluctuations. A well-diversified portfolio aims for a mix of assets whose correlations average out to a relatively low number.
Pitfalls and Dynamic Nature of Correlation
It’s important to recognize that correlation is not static. It can change over time, especially during periods of market stress. In times of crisis, correlations between assets that usually move independently can tend towards +1.0, a phenomenon often referred to as “flight to safety” or “crisis correlation.” This means that the diversification benefits you expect might disappear precisely when you need them most. Therefore, continuous monitoring and re-evaluation of portfolio correlations are essential. Additionally, correlation measures association, not causation; just because two assets move together doesn’t mean one causes the other to move.
Beyond the Basics: Other Key Financial Coefficients
While Beta and correlation are perhaps the most frequently discussed, the financial landscape is rich with other coefficients that offer unique insights into performance, risk, and efficiency.
R-squared: Measuring Explanation Power
R-squared (R²) is a statistical measure that represents the proportion of the variance for a dependent variable that’s explained by an independent variable or variables in a regression model. In finance, it’s often used in conjunction with Beta to assess the reliability of Beta itself.
- Interpretation: An R-squared value ranges from 0 to 1 (or 0% to 100%). If a stock’s returns have an R-squared of 0.85 when regressed against the S&P 500, it means 85% of the stock’s price movements can be explained by movements in the S&P 500.
- Practical Use: A high R-squared (typically above 0.70) indicates that Beta is a more reliable measure for that particular security’s market-related risk. A low R-squared suggests that other factors beyond the overall market are driving the security’s returns, and thus its Beta might not be a good indicator of its sensitivity to broad market movements.
Alpha: The Pursuit of Excess Returns
Alpha (α) measures the active return on an investment, comparing its performance against a market benchmark or its expected return (as predicted by CAPM), after adjusting for risk. In essence, Alpha represents the value added by a fund manager or an investment strategy beyond what market movements alone would suggest.
- Interpretation:
- Positive Alpha: The investment has outperformed its benchmark or generated excess returns after accounting for risk. This is often attributed to superior stock picking or market timing skills.
- Negative Alpha: The investment has underperformed its benchmark or failed to generate its expected return, even after adjusting for risk.
- Zero Alpha: The investment has performed exactly as expected, providing returns commensurate with its risk.
- Practical Use: Alpha is a key metric for evaluating the skill of active fund managers and for identifying investments that truly generate value beyond passive market exposure. Investors often seek funds with consistently positive Alpha, although achieving it consistently is challenging.
Sharpe Ratio: Risk-Adjusted Performance
While not a single coefficient in the same vein as Beta or correlation, the Sharpe Ratio is a critical performance metric that incorporates the concept of coefficients by comparing an investment’s excess return (return above the risk-free rate) per unit of total risk (standard deviation).
- Formula: (Portfolio Return – Risk-Free Rate) / Standard Deviation of Portfolio Returns.
- Interpretation: A higher Sharpe Ratio indicates a better risk-adjusted return. It helps investors determine if the excess returns generated are sufficient to compensate for the additional risk taken.
- Practical Use: The Sharpe Ratio is invaluable for comparing different investment opportunities. An asset with a higher return but also significantly higher volatility might have a lower Sharpe Ratio than a more moderately performing but less volatile asset, indicating the latter is a more efficient investment.
Integrating Coefficients for Strategic Financial Planning
Understanding individual coefficients is merely the first step. The true power lies in integrating these metrics into a comprehensive framework for strategic financial planning. By combining Beta, correlation, R-squared, Alpha, and Sharpe Ratio, investors and financial professionals can construct robust portfolios, make informed allocation decisions, and gain a nuanced perspective on risk and return.
A Holistic Approach to Investment Analysis
A holistic approach means not relying on any single coefficient in isolation. For instance, evaluating a stock solely on its high Beta might suggest high growth potential, but without considering its correlation to other portfolio assets and its R-squared, you might be adding undiversifiable risk without fully understanding its drivers. Similarly, a high Alpha is attractive, but it needs to be assessed alongside the Sharpe Ratio to ensure that the excess returns aren’t coming at an unacceptably high level of total risk. The interplay between these coefficients provides a multi-dimensional view of an investment’s characteristics.
Leveraging Financial Tools and Data
The good news for today’s investors is that sophisticated financial tools and readily available data have made the calculation and interpretation of these coefficients more accessible than ever. Most reputable financial platforms and brokerage services provide these metrics for individual stocks, funds, and portfolios. Leveraging these tools allows for dynamic analysis, enabling investors to test different asset allocations, monitor portfolio risk in real-time, and refine their strategies based on evolving market conditions. Beyond basic calculations, advanced analytical software can run simulations and sensitivity analyses, providing deeper insights into how coefficients might change under various market scenarios.

The Human Element: Interpretation and Experience
Ultimately, while coefficients provide objective, data-driven insights, they are not infallible crystal balls. The interpretation of these numbers, the judgment calls made based on their values, and the ability to adapt to unforeseen circumstances remain firmly within the human domain. Experience, market intuition, and a thorough understanding of the qualitative factors underpinning the numbers are crucial. Coefficients are powerful guides, but they don’t replace the need for critical thinking, due diligence, and a well-defined investment philosophy.
In conclusion, “What’s the coefficient?” is a question that opens a gateway to profound financial understanding. From Beta’s insights into market sensitivity to correlation’s role in diversification and Alpha’s measure of true value creation, these numerical measures are the indispensable language of modern finance. By embracing and understanding them, investors can move beyond speculation, navigating the complexities of the financial markets with greater confidence, precision, and a significantly enhanced ability to achieve their financial objectives.
aViewFromTheCave is a participant in the Amazon Services LLC Associates Program, an affiliate advertising program designed to provide a means for sites to earn advertising fees by advertising and linking to Amazon.com. Amazon, the Amazon logo, AmazonSupply, and the AmazonSupply logo are trademarks of Amazon.com, Inc. or its affiliates. As an Amazon Associate we earn affiliate commissions from qualifying purchases.