The seemingly simple question, “What’s the feel like temperature outside?”, belies a fascinating tapestry of scientific understanding, advanced sensor technology, complex algorithms, and sophisticated user interface design. It’s a query that transcends the mere reading of a thermometer, diving into the intricate interplay between environmental factors and human physiological perception. In an age where instant information is a baseline expectation, the ability to rapidly and accurately translate raw meteorological data into an intuitive “feel like” temperature has become a cornerstone of modern weather technology, profoundly influencing our daily decisions, from what we wear to how we plan our outdoor activities.
This article delves into the technological underpinnings that empower us to answer this vital question. We’ll explore the scientific principles that define apparent temperature, unpack the sophisticated sensor networks and computational models that gather and process vast amounts of data, trace the evolution of weather tech from analog instruments to AI-driven assistants, examine how this metric enhances user experience, and peer into the future of environmental sensing, where predictive comfort and smart living converge. Far from a trivial piece of information, the “feel like” temperature represents a pinnacle of technological achievement aimed at making our interaction with the environment more informed, comfortable, and intelligent.
The Science Behind “Feel Like” Temperature: More Than Just a Number
The actual air temperature, as measured by a standard thermometer, is often just one piece of the puzzle when describing how warm or cold it genuinely feels. Our bodies react to a confluence of atmospheric conditions, leading to a perceived temperature that can diverge significantly from the ambient reading. This discrepancy is precisely what “feel like” temperature, or apparent temperature, aims to capture and quantify.
Defining Apparent Temperature: Heat Index and Wind Chill
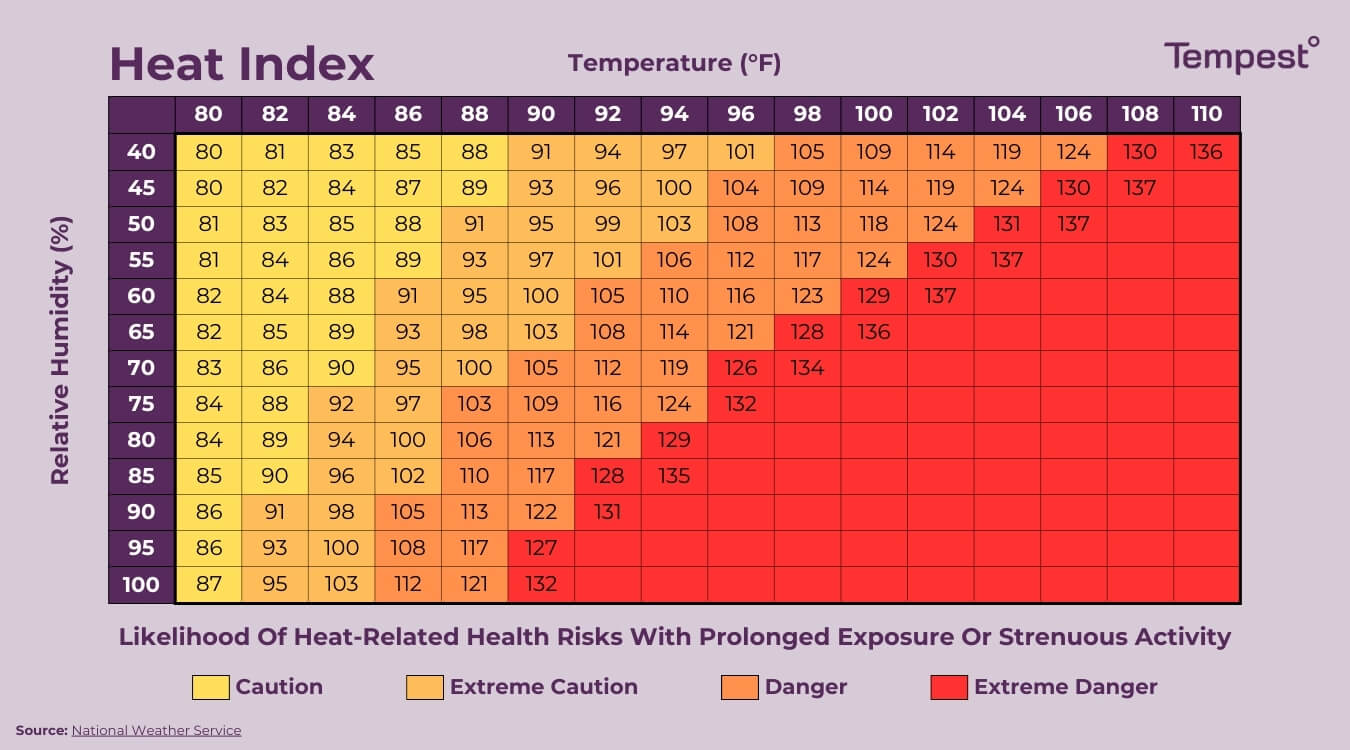
The concept of apparent temperature primarily manifests through two widely recognized metrics: the Heat Index and Wind Chill. The Heat Index quantifies how hot it feels when relative humidity is combined with the air temperature. High humidity impedes the body’s ability to cool itself through sweat evaporation, making a warm day feel sweltering and oppressive. Conversely, Wind Chill describes how cold it feels when wind speed is combined with the air temperature. Wind rapidly draws heat away from the body, making a chilly day feel much colder than the thermometer suggests, increasing the risk of frostbite. Other factors, such as solar radiation (direct sunlight) and infrared radiation from surrounding surfaces, also play a role, contributing to the overall thermal comfort equation that advanced models attempt to solve.
Key Environmental Factors and Human Perception
The human body is a complex thermoregulatory system, constantly striving to maintain a core temperature of around 37°C (98.6°F). This intricate balancing act is influenced by several critical environmental factors:
- Air Temperature: The foundational element, indicating the kinetic energy of air molecules.
- Humidity: The amount of moisture in the air. High humidity reduces evaporative cooling, making hot temperatures feel hotter.
- Wind Speed: The movement of air. Wind increases convective heat loss, making cold temperatures feel colder, and also enhances evaporative cooling in warmer conditions.
- Solar Radiation: Direct sunlight adds significant heat energy to exposed skin and clothing.
- Cloud Cover: Affects solar radiation, reducing its impact.
- Precipitation: Rain, snow, or sleet can dramatically alter perceived temperature through evaporative cooling (rain) or direct contact with cold moisture (snow/sleet).
These factors interact in complex ways, with the perceived “feel” being a subjective integration by the brain based on sensory input. The technological challenge lies in objectively quantifying this subjective experience using scientific principles and data.
Algorithmic Models and Their Genesis
To translate these complex interactions into a single, understandable “feel like” number, meteorologists and scientists have developed sophisticated algorithmic models. These models are built upon extensive physiological research into human heat exchange and comfort.
- Steadman’s Apparent Temperature: One of the most influential models, developed by Robert Steadman, considers air temperature, humidity, and wind speed, and importantly, also accounts for the effects of solar radiation and clothing insulation to provide a comprehensive estimate of thermal comfort.
- NWS Wind Chill Index: Developed by the U.S. National Weather Service (NWS) and Meteorological Service of Canada, this index is widely used to calculate the perceived coldness due to wind.
- NWS Heat Index: Also from the NWS, this index combines air temperature and relative humidity to determine an apparent temperature of how hot it feels.
These models, often complex equations or lookup tables, form the bedrock for the calculations performed by modern weather applications and devices. They are continually refined and validated against real-world data and human comfort studies to improve accuracy and universality, albeit with some regional variations in application.
Technological Enablers: Bridging the Gap Between Data and Perception
The journey from raw atmospheric data to a personalized “feel like” temperature display on your smartphone is a testament to the power of interconnected technologies. It involves a global network of sensors, massive data pipelines, sophisticated computational infrastructure, and the intelligent application of artificial intelligence.
Sensor Networks and Data Collection
At the heart of any weather forecasting system are the sensors that collect environmental data. A vast and diverse network of instruments continuously monitors the atmosphere:
- Ground-Based Weather Stations: Thousands of automated weather stations worldwide measure temperature, humidity, wind speed and direction, pressure, and precipitation. These range from official meteorological sites to smaller, privately owned stations contributing to community networks.
- Radiosondes: Weather balloons carrying instrument packages (radiosondes) ascend through the atmosphere, transmitting data on temperature, humidity, and wind velocity at various altitudes.
- Weather Satellites: Orbiting Earth, these satellites provide invaluable data, including cloud cover, atmospheric water vapor, surface temperatures, and even wind patterns inferred from cloud movement. They are crucial for global coverage and tracking large-scale weather systems.
- Radar Systems: Doppler radar detects precipitation, its intensity, and movement, and can infer wind shear and other atmospheric phenomena.
- Ocean Buoys: Floating instruments measure sea surface temperature, air temperature, wind, and wave height, critical for marine forecasts and understanding global climate patterns.
- IoT Devices and Smart Homes: Increasingly, personal weather stations, smart thermostats, and other Internet of Things (IoT) devices contribute hyperlocal data, adding a fine-grained layer of observation.
This colossal influx of diverse data streams is the lifeblood of any accurate weather prediction, including the computation of apparent temperature.
Data Processing and Computational Power
The sheer volume and velocity of meteorological data necessitate immense processing capabilities. Raw sensor readings are often noisy, incomplete, or require calibration.
- Data Aggregation and Cleaning: Data from various sources must be collected, aggregated, and rigorously cleaned to remove errors and ensure consistency. This often involves intricate data pipelines and robust error-checking algorithms.
- Supercomputers and Cloud Infrastructure: Numerical Weather Prediction (NWP) models, which simulate atmospheric behavior, require the most powerful supercomputers on the planet. These models solve complex differential equations across a 3D grid of the atmosphere. Cloud computing platforms also play an increasing role, providing scalable resources for processing and running forecast models.
- Real-time Analysis: For current “feel like” temperatures, data needs to be processed almost instantaneously. Low-latency data transmission and high-performance computing are critical to provide up-to-the-minute readings.
This computational backbone is what allows complex atmospheric models to run, integrating observational data with physical laws to project future conditions, including the nuanced factors contributing to apparent temperature.
Predictive Modeling and AI Integration
While traditional NWP models are highly effective, the integration of Artificial Intelligence (AI) and Machine Learning (ML) is revolutionizing the accuracy and personalization of weather forecasting, particularly for metrics like “feel like” temperature.
- Post-Processing and Bias Correction: AI models can learn from historical data to correct biases in NWP model outputs, especially for localized conditions that global models might miss. This can lead to more accurate “feel like” temperature predictions for specific microclimates.
- Pattern Recognition: ML algorithms excel at identifying complex patterns in vast datasets that might be overlooked by human forecasters or traditional models. This helps in understanding subtle interactions between weather variables.
- Hyperlocal Forecasting: AI can integrate data from diverse, non-traditional sources (e.g., traffic camera images, social media posts, private sensor networks) to create extremely localized forecasts, offering more precise “feel like” temperatures for a specific street or neighborhood.
- Personalized Comfort Prediction: In the future, AI could potentially combine external weather data with personal biometric data from wearables (e.g., heart rate, skin temperature, activity level) to offer truly personalized comfort indices, suggesting optimal clothing or indoor environmental adjustments.
AI’s ability to learn from data, identify complex relationships, and adapt to changing conditions is making the “feel like” temperature more accurate, localized, and relevant than ever before.
The Evolution of Weather Tech: From Analog Tools to Intelligent Assistants
The journey to confidently ask “What’s the feel like temperature outside?” and receive an instant, accurate answer is a story of continuous technological advancement, transforming weather observation from a specialized, laborious task into an accessible, everyday utility.
Early Weather Instruments and Manual Interpretation
For centuries, understanding the weather relied on simple, analog instruments and human observation. Barometers tracked atmospheric pressure (often used to predict storms), thermometers measured air temperature, and anemometers estimated wind speed. Early meteorologists meticulously recorded these readings, using their experience and rudimentary charts to make educated guesses about future conditions. The concept of “feel like” temperature was largely anecdotal, based on personal experience rather than scientific quantification. While ingenious for their time, these methods were inherently limited in scope, accuracy, and reach.
The Digital Revolution: Computers and Early Forecasting Models
The mid-20th century marked a pivotal shift with the advent of digital computers. This breakthrough enabled the development of Numerical Weather Prediction (NWP) models, which could mathematically simulate the atmosphere’s physical processes. By inputting current atmospheric conditions, these early supercomputers could project future states, offering objective, data-driven forecasts that vastly surpassed manual methods. While initial models were crude by today’s standards, they laid the foundation for modern meteorology. The first attempts to quantify “feel like” concepts like wind chill and heat index began to emerge during this era, powered by these nascent computational capabilities. Data from ground stations and radiosondes were digitized, making it possible to feed vast quantities of observations into these hungry machines.
The Smartphone Era: Apps, Wearables, and Ubiquitous Access
The turn of the 21st century and the explosion of mobile technology brought weather information directly to the fingertips of billions. Smartphones, with their always-on connectivity and sophisticated displays, became the primary interface for weather data. Dedicated weather apps proliferated, offering aesthetically pleasing interfaces, detailed forecasts, and, crucially, prominent displays of the “feel like” temperature.
This era saw:
- Integration of Multiple Data Sources: Apps combined data from government meteorological agencies, private weather services, and even crowd-sourced information to provide comprehensive, hyperlocal forecasts.
- Personalization: Users could set preferred locations, receive alerts, and customize the metrics displayed, making the “feel like” temperature a standard and expected feature.
- Wearable Technology: Smartwatches and fitness trackers began to integrate weather updates, including apparent temperature, allowing users to quickly check conditions without even pulling out their phone.
- Smart Home Integration: Weather data became a component of smart home ecosystems, with smart thermostats potentially adjusting settings based on external “feel like” conditions.
The smartphone transformed “What’s the feel like temperature outside?” from a niche meteorological inquiry into a universally accessible piece of daily information.
Voice Assistants and Conversational AI: Instant Weather Insights
The most recent leap in weather tech accessibility has come with the rise of voice-activated assistants and conversational AI. Devices like Amazon Alexa, Google Assistant, Apple’s Siri, and others have normalized asking natural language questions about the weather.
- Natural Language Processing (NLP): These systems use advanced NLP to understand diverse queries, instantly extracting the intent behind “what’s the feel like temperature,” “how hot is it outside with the humidity,” or “is it windy enough to feel colder.”
- Instantaneous Data Retrieval: Upon understanding the query, the AI rapidly queries weather databases, processes the relevant “feel like” algorithm, and delivers an audible, concise answer, often in a conversational tone.
- Seamless Integration: This integration into smart speakers, smartphones, and even cars means weather information is always just a voice command away, removing the need to physically interact with a screen.
This development has made the “feel like” temperature more accessible and intuitive than ever, truly embedding it into the fabric of our connected lives.
User Experience and the “Feel Like” Metric: Personalizing Our World
In an information-rich society, raw data is only valuable if it’s interpretable and actionable. The “feel like” temperature excels in this regard, translating complex meteorological science into a relatable human experience, thereby significantly enhancing user interaction with weather information.
Beyond Raw Data: Making Weather Relatable
The primary genius of the “feel like” temperature lies in its ability to simplify complex atmospheric conditions into a single, intuitive number that directly relates to human comfort. While an air temperature of 25°C might mean different things depending on humidity and wind, a “feel like” temperature of 30°C due to high humidity, or 15°C due to strong winds, immediately conveys the need for specific clothing or activity adjustments.
- Actionable Insights: This metric provides immediate, actionable insights for daily planning. Should I wear a light jacket or just a t-shirt? Is it safe for a long run, or will the heat index be too high? The “feel like” temperature helps answer these questions without requiring the user to be a meteorologist.
- Reduced Cognitive Load: Users don’t need to mentally calculate the effects of wind or humidity; the technology does it for them, presenting the most relevant information upfront.
- Universal Understanding: While the underlying calculations might vary slightly, the concept of “feel like” temperature is universally understood as a proxy for personal thermal comfort.
This focus on relatability transforms abstract data into practical guidance, making weather forecasts a more integral and user-friendly part of daily life.
Customization and Personalization in Weather Apps
Modern weather applications leverage the “feel like” metric by offering extensive customization and personalization features that cater to individual user preferences and needs.
- Preferred Metric Display: Users can often choose whether to prioritize air temperature, “feel like” temperature, or both prominently on their app’s home screen.
- Activity-Specific Guidance: Some advanced apps use the “feel like” temperature to suggest suitable outdoor activities. For instance, if the wind chill is too low, it might advise against cycling; if the heat index is too high, it might recommend indoor activities or precautions.
- Alert Customization: Users can set alerts not just for absolute temperature, but also for when the “feel like” temperature crosses certain thresholds, prompting them to dress appropriately or take shelter.
- Integration with Calendars and Routines: Some apps integrate weather forecasts into personal schedules, providing context for planned outdoor events or commutes, often with the “feel like” temperature as a key consideration.
These features move beyond generic forecasts, tailoring the weather experience to each user’s specific lifestyle and sensitivities.
Integrating Weather into Smart Homes and IoT Ecosystems
The integration of “feel like” temperature data extends beyond personal devices into the broader Internet of Things (IoT) ecosystem, particularly within smart homes. This allows for environmental control systems to react intelligently to perceived comfort conditions.
- Smart Thermostats: Advanced smart thermostats can utilize external “feel like” temperature data in conjunction with internal readings to optimize heating and cooling. If the “feel like” temperature outside is significantly higher due to humidity, the thermostat might preemptively lower the indoor temperature slightly to maintain comfort, even if the absolute outdoor temperature isn’t excessively high.
- Automated Blinds and Shades: In response to high “feel like” temperatures (especially those influenced by solar radiation), smart blinds can automatically close during peak sunlight hours to reduce heat gain, maintaining a cooler indoor environment and saving energy.
- Smart Irrigation Systems: While primarily driven by precipitation, some smart irrigation systems might also factor in high “feel like” temperatures and low humidity, which indicate faster evaporation, adjusting watering schedules to prevent plant stress.
- Personal Comfort Zones: Future smart home systems could potentially learn individual occupants’ preferred “feel like” comfort zones and dynamically adjust lighting, temperature, and airflow to maintain those conditions, creating truly personalized indoor climates.
By embedding “feel like” temperature data into automated home systems, technology is moving towards proactive, intelligent environments that adapt to our comfort needs without direct intervention.
The Future of Environmental Sensing: Predictive Comfort and Smart Living
The evolution of “feel like” temperature technology is far from complete. As sensors become more ubiquitous, data processing more powerful, and AI more sophisticated, we are on the cusp of a new era where environmental sensing offers unprecedented levels of prediction, personalization, and proactive adaptation.
Hyperlocal and Microclimate Forecasting
The immediate future points towards increasingly granular and precise “feel like” predictions. While current forecasts provide city-level data, the next generation will offer hyper-local insights:
- Street-Level Accuracy: Predicting “feel like” temperature variations from one block to the next, accounting for urban canyons, tree cover, proximity to water bodies, and building materials.
- Personalized Microclimates: Integrating data from densely distributed personal weather stations, smart city sensors, and even autonomous vehicles to map out real-time microclimates within a smaller area.
- Dynamic Modeling: Using computational fluid dynamics (CFD) models combined with AI to simulate how wind flows around buildings and how heat islands form, providing truly dynamic “feel like” temperature maps.
This level of detail will enable planning with unparalleled precision, whether for a jog through the park or setting up an outdoor event.
Advanced Sensor Fusion and AI-Powered Predictions
The future of environmental sensing will move beyond just temperature, humidity, and wind to encompass a much broader array of environmental factors, fusing these diverse data streams with advanced AI.
- Holistic Comfort Index: Combining “feel like” temperature with air quality (pollutants, allergens), UV index, noise levels, and even light spectrum to create a comprehensive “Environmental Comfort Index.”
- Biometric Integration: Integrating personal health data from wearables (e.g., skin temperature, heart rate variability, activity levels) with external “feel like” data to predict individual thermal stress or comfort needs. This could lead to personalized recommendations for hydration, rest, or activity modification.
- Multi-Modal Sensing: Utilizing new types of sensors, such as thermal cameras for radiant heat, lidar for atmospheric profiling, and acoustic sensors for environmental noise, to build a richer picture of the outdoor environment.
This advanced sensor fusion will enable AI to generate predictions that are not just about “feeling” the temperature, but about understanding the overall environmental impact on human well-being.
Proactive Adaptations and Autonomous Systems
The ultimate goal of this technological evolution is to create environments that intelligently adapt to our comfort needs, often without direct human intervention.
- Self-Adjusting Smart Homes: Imagine a home that proactively adjusts its heating, cooling, ventilation, and lighting not just based on a schedule, but on predicted “feel like” conditions, historical user preferences, and even the real-time biometric data of its occupants.
- Smart City Infrastructure: Public spaces could adapt in real-time. Smart streetlights might dim or brighten based on cloud cover affecting perceived light, public fountains could activate to provide cooling mist during high heat index days, and public transport could optimize routes based on weather-related traffic impacts.
- Personalized Outdoor Gear: Future wearables could provide real-time suggestions for clothing adjustments or even integrate with smart fabrics that adapt their thermal properties based on external “feel like” conditions.
- Health and Safety Alerts: Predictive models could issue highly localized, personalized alerts for heatstroke risk, frostbite danger, or allergen exposure based on fused environmental and personal data.
These autonomous systems represent a significant leap towards truly smart living, where our surroundings proactively contribute to our comfort, health, and well-being.

Ethical Considerations and Data Privacy
As environmental sensing becomes more sophisticated and personalized, it also raises important ethical questions regarding data privacy and surveillance. The collection of highly granular, potentially biometric data, coupled with location information, necessitates robust privacy frameworks and transparent data usage policies. Ensuring that these powerful technologies are used responsibly, ethically, and with user consent will be a critical challenge in shaping the future of predictive comfort and smart living.
From its humble beginnings as a physiological concept, the “feel like” temperature has been transformed by technology into an indispensable tool for navigating our daily lives. It represents the successful fusion of complex scientific models, vast sensor networks, powerful computational engines, and intuitive user interfaces. As we look ahead, the journey continues, promising an even more integrated, personalized, and predictive understanding of our environment. The seemingly simple query, “What’s the feel like temperature outside?”, is a testament to how technology is continually enhancing our interaction with the world, making our comfort a quantifiable and manageable reality.
aViewFromTheCave is a participant in the Amazon Services LLC Associates Program, an affiliate advertising program designed to provide a means for sites to earn advertising fees by advertising and linking to Amazon.com. Amazon, the Amazon logo, AmazonSupply, and the AmazonSupply logo are trademarks of Amazon.com, Inc. or its affiliates. As an Amazon Associate we earn affiliate commissions from qualifying purchases.