In the realm of personal and business finance, numbers are rarely useful in isolation. Knowing that a stock gained $10 is meaningless unless you know whether you invested $100 or $10,000 to get that return. To truly understand the health of your portfolio, the efficiency of your business, or the sustainability of your household budget, you must master the language of percentages. Finding a number as a percentage is the foundational skill that allows for comparison, scaling, and strategic decision-making.
Whether you are calculating your tax liability, determining your debt-to-income ratio, or evaluating the dividend yield of a prospective investment, the ability to convert raw figures into percentages is what separates a passive observer from a financially literate strategist.

The Core Mechanics: Understanding Percentages in Personal Finance
At its simplest level, a percentage is a way of expressing a number as a fraction of 100. In finance, this “100” represents the whole—your total income, your total investment capital, or the total cost of a project. By converting specific costs or gains into a percentage, you gain a standardized metric that allows you to compare different financial scenarios on an even playing field.
The Basic Formula: Part over Whole
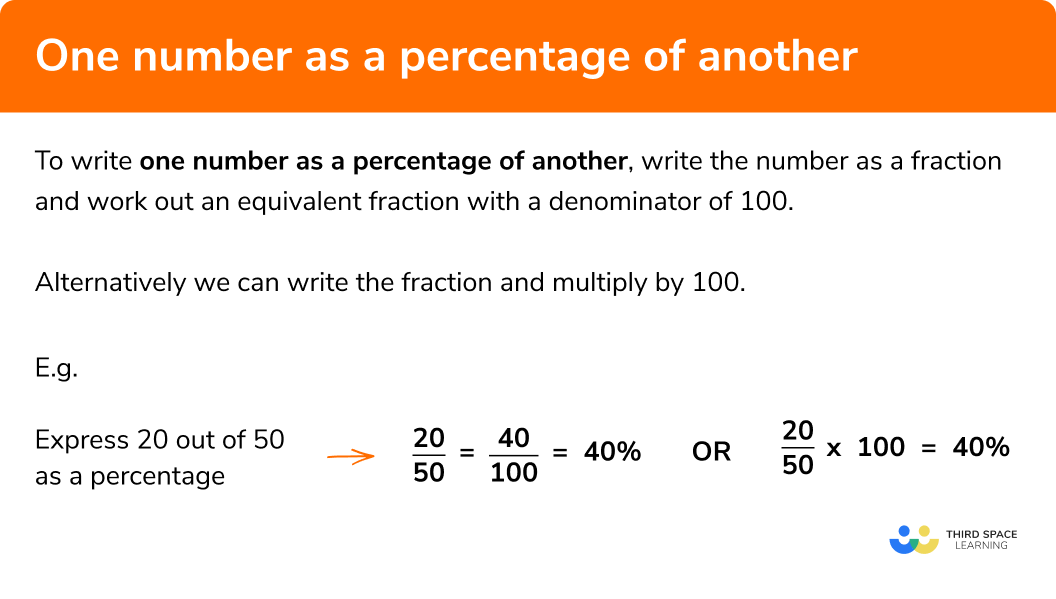
To find any number as a percentage of another, you use the fundamental formula:
(Part / Whole) × 100 = Percentage (%)
For example, if you earn $5,000 a month and your rent is $1,500, finding the percentage of your income dedicated to housing is straightforward:
$1,500 / $5,000 = 0.3
0.3 × 100 = 30%
In this scenario, 30% is a critical benchmark. Financial advisors often recommend keeping housing costs below 30% of gross income. Without converting the raw dollar amount into a percentage, it is difficult to see how that expense fits into the broader context of fiscal health.
Why Decimals and Fractions Matter in Financial Math
Before multiplying by 100, you are left with a decimal (like the 0.3 in the example above). In financial modeling and spreadsheet software like Excel or Google Sheets, this decimal is often more useful than the percentage figure itself. When you see a “5% interest rate,” the math behind the scenes is treating it as 0.05. Understanding that a percentage is simply a scaled decimal allows you to quickly perform more complex calculations, such as determining compound interest or calculating the impact of inflation on your purchasing power.
Calculating Growth and Performance: ROI and Compound Interest
In the world of investing, raw numbers can be deceptive. A “gain of $1,000” sounds impressive, but if it took a $100,000 investment to achieve it, that represents only a 1% return—which might be underperforming compared to a high-yield savings account. Finding the percentage of growth is the only way to accurately measure investment success.
Measuring Your Portfolio’s Success (Percentage Growth)
To find the percentage increase or decrease of an investment, you need the “Percentage Change” formula:
[(Current Value – Original Value) / Original Value] × 100
Consider a stock purchased for $50 that is now worth $65.
($65 – $50) / $50 = 0.30
0.30 × 100 = 30% growth.
This calculation is vital for “Return on Investment” (ROI) analysis. By viewing your gains as percentages, you can compare the performance of a real estate holding against a mutual fund or a cryptocurrency asset, regardless of the different dollar amounts invested in each.
The Impact of Annual Percentage Rates (APR) and Yield (APY)
When borrowing money or saving it, the percentage is the price of the money.
- APR (Annual Percentage Rate): This represents the cost of borrowing as a percentage of the principal balance. Finding the interest payment as a percentage helps you understand the true cost of a loan beyond the monthly payment.
- APY (Annual Percentage Yield): This accounts for compound interest. When your interest earns interest, the effective percentage you receive over a year increases.
Understanding how to calculate these percentages allows you to identify “leakage” in your wealth—areas where high-percentage interest rates on debt are eroding your low-percentage gains in savings.
Business Finance and Profitability Metrics
For entrepreneurs and business owners, finding numbers as percentages is not just a matter of curiosity; it is a requirement for survival. Percentages provide a snapshot of operational efficiency that raw revenue figures cannot provide.
Gross vs. Net Profit Margins
A business might generate $1 million in sales, but if the expenses are $950,000, the business is on thin ice. We use percentage margins to evaluate this:
- Gross Profit Margin: (Gross Profit / Revenue) × 100. This shows how efficiently a company produces its goods or services.
- Net Profit Margin: (Net Income / Revenue) × 100. This shows how much of every dollar earned actually translates into profit after all taxes and expenses are paid.
If your net profit margin is 5%, you know that for every $100 you bring in, only $5 stays in the company’s pocket. Monitoring these percentages over time allows a business to spot trends—such as rising supplier costs—long before they become a crisis in the cash flow statement.
Using Percentages for Expense Analysis and Cost Control
The “Common Size” financial statement is a tool where every line item is expressed as a percentage of total sales. This allows business owners to see, for example, that marketing is taking up 15% of revenue while payroll is consuming 40%. By finding these numbers as percentages, you can compare your business against industry benchmarks. If the average marketing spend in your industry is 7%, but yours is 15%, the percentage highlights an area for potential optimization.
Tax Planning and Strategic Debt Management
Money management is often a game of “net” results. What you keep is more important than what you make. Percentages are the primary tool used by the government and lenders to determine your financial standing.
Understanding Marginal Tax Brackets as Percentages
The US tax system (and many others) is progressive, meaning different portions of your income are taxed at different percentages. Finding your “Effective Tax Rate” is a matter of dividing your total tax paid by your total taxable income.
If you earn $100,000 but pay $15,000 in taxes, your effective tax rate is 15%. However, your “Marginal Tax Rate” might be 22% or 24%. Understanding the difference between these percentages is essential for tax-loss harvesting and making contributions to tax-advantaged accounts like a 401(k) or IRA.
Debt-to-Income Ratio: The Percentage Lenders Watch
When you apply for a mortgage or a car loan, lenders don’t just look at your salary; they look at your Debt-to-Income (DTI) ratio. This is your total monthly debt payments divided by your gross monthly income.
(Total Monthly Debt / Gross Monthly Income) × 100 = DTI %
Lenders typically look for a DTI below 36% to 43%. If your DTI is 50%, it tells the lender—and should tell you—that half of your income is already spoken for before you even buy groceries or pay for utilities. Finding this number as a percentage gives you a clear target for debt reduction.
Tools for Financial Precision: Beyond the Basic Calculator
While the “part divided by whole” formula is the gold standard, modern financial management relies on tools that automate these percentage calculations to prevent human error and save time.
Excel and Google Sheets for Automated Financial Modeling
In a spreadsheet, you don’t need to multiply by 100 manually. By typing =A1/B1 and then clicking the “Percentage” format button (%), the software handles the conversion.
For more complex financial analysis, you can use functions like:
=RATE(): To find the interest rate percentage per period of an annuity.=IRR(): To find the Internal Rate of Return for a series of cash flows.
These tools allow you to perform “what-if” analysis. For instance, you can see how a 1% increase in your savings rate percentage can lead to tens of thousands of dollars in additional wealth over thirty years due to the power of compounding.

Financial Calculators and Specialized Online Tools
From mortgage amortization schedules to retirement calculators, these tools are essentially sophisticated engines for finding numbers as percentages. They help you visualize the “Asset Allocation” of your portfolio—ensuring that you are not over-leveraged in one sector. A balanced portfolio might aim for 60% stocks and 40% bonds; finding your current numbers as a percentage of the total portfolio tells you exactly when it is time to rebalance.
By mastering the ability to find a number as a percentage, you move beyond simply “checking your balance.” You begin to analyze the velocity, efficiency, and sustainability of your money. In the world of finance, percentages are the ultimate truth-tellers, providing the clarity needed to build long-term wealth and maintain fiscal discipline.
aViewFromTheCave is a participant in the Amazon Services LLC Associates Program, an affiliate advertising program designed to provide a means for sites to earn advertising fees by advertising and linking to Amazon.com. Amazon, the Amazon logo, AmazonSupply, and the AmazonSupply logo are trademarks of Amazon.com, Inc. or its affiliates. As an Amazon Associate we earn affiliate commissions from qualifying purchases.