
In the world of finance, numbers are the language of reality. However, raw data—such as a $1 million revenue increase or a $50 drop in a stock price—rarely tells the full story in isolation. To truly understand the health of an investment, the efficiency of a business operation, or the trajectory of a personal savings plan, one must master the concept of relative change. The percentage difference is the fundamental metric that translates raw figures into actionable insights.
Whether you are a corporate treasurer evaluating quarterly performance or a retail investor tracking portfolio volatility, knowing how to calculate and interpret the percentage difference between two figures is an indispensable skill. It allows for a standardized comparison across different scales, industries, and timeframes, providing a clear lens through which financial health can be viewed.

1. The Core Mechanics: Understanding the Percentage Difference Formula
At its simplest level, the percentage difference (often referred to in finance as percentage change) measures the degree of change between an initial value and a final value relative to the starting point. This calculation is vital because it provides context. A $10,000 profit increase is monumental for a local bakery, but negligible for a Fortune 500 company. Converting that $10,000 into a percentage levels the playing field.
The Standard Financial Formula
The mathematical expression for calculating the percentage difference between two figures is:
Percentage Difference = [(New Value – Original Value) / |Original Value|] × 100
In financial modeling, the “Original Value” is usually the baseline (such as last year’s revenue), and the “New Value” is the current figure. The result tells you by what fraction the value has grown or shrunk.
Distinguishing Between Difference and Change
In professional finance, we often distinguish between “percentage difference” and “percentage change.” While the terms are used interchangeably in casual conversation, “change” usually implies a chronological progression (Time A to Time B), whereas “difference” might compare two static figures, such as the price of Gold versus the price of Platinum. When comparing two static figures where neither is logically the “base,” the denominator is often the average of the two numbers. However, for most money-related tasks, we focus on the change from a specific reference point.
The Importance of the Absolute Value in the Denominator
For most personal and business finance scenarios, values are positive. However, in advanced corporate accounting or debt restructuring, you may encounter negative starting values. Using the absolute value in the denominator ensures that the direction of the percentage (positive or negative) correctly reflects the direction of the movement, preventing mathematical errors in loss-to-profit transitions.
2. Investment Analysis: Tracking Performance and Volatility
For investors, the percentage difference is the primary metric for measuring Return on Investment (ROI). Without it, comparing the success of a high-priced stock like Berkshire Hathaway (BRK.A) against a lower-priced penny stock would be impossible.
Calculating Portfolio Growth
If you invested $50,000 in a diversified portfolio at the start of the fiscal year and its value rose to $57,500 by December 31st, the percentage difference allows you to benchmark your performance against market indices like the S&P 500.
- Step 1: $57,500 – $50,000 = $7,500 (Absolute Gain)
- Step 2: $7,500 / $50,000 = 0.15
- Step 3: 0.15 × 100 = 15%
This 15% figure is your annual return. By comparing this percentage difference to the inflation rate or the yield on a “risk-free” asset like a Treasury bond, you can determine if your capital allocation strategy is effective.
Analyzing Market Volatility and Drawdowns
Percentage difference is also used to measure “drawdowns,” or the peak-to-trough decline during a specific period. If a stock drops from $200 to $150, that is a 25% decline. To return to the original $200, the stock must then increase by 33.3%. This mathematical asymmetry—where the percentage increase required to recover a loss is always greater than the percentage of the loss itself—is a foundational concept in risk management and capital preservation.
Yield Comparisons in Fixed Income
In the bond market, investors look at the percentage difference between interest rates (yields). If a bond yield moves from 4% to 5%, that is a 1-percentage-point increase, but a 25% increase in the yield itself. Understanding this distinction is crucial for traders who profit from small fluctuations in debt markets.

3. Business Intelligence: Measuring Corporate Efficiency and Growth
For business owners and financial officers, the percentage difference is the “pulse” of the company. It is used in nearly every line of the income statement to track trends and optimize operations.
Year-over-Year (YoY) and Quarter-over-Quarter (QoQ) Analysis
Standard financial reporting relies heavily on YoY comparisons. By calculating the percentage difference between revenue in Q3 of this year and Q3 of last year, a business can account for seasonal fluctuations. A retail business might see a 500% increase in sales from November to December (Month-over-Month), which seems impressive, but a 2% decrease compared to the previous December (Year-over-Year) would signal a serious underlying problem.
Margin Analysis and Cost Control
Percentage difference is essential for maintaining healthy margins. If a company’s cost of goods sold (COGS) increases from $40 per unit to $44 per unit, that is a 10% increase in costs. To maintain the same net profit margin, the business must calculate how much they need to raise their selling price. If they cannot pass that 10% increase onto the consumer, their bottom-line profitability will shrink, potentially leading to a decrease in the company’s valuation.
Variance Analysis in Budgeting
Corporate controllers use percentage difference for “variance analysis.” This involves comparing the “Actual” financial results against the “Budgeted” or “Forecasted” figures. A “favorable variance” occurs when actual revenue is higher than budgeted, or expenses are lower. By quantifying these variances as percentages, management can quickly identify which departments are overspending or underperforming relative to their targets.
4. Practical Implementation: Tools for Financial Calculation
While the formula is straightforward, the volume of data in modern finance requires efficient tools for calculation. Accurate execution is paramount; a decimal error in a billion-dollar merger can be catastrophic.
Leveraging Spreadsheets (Excel and Google Sheets)
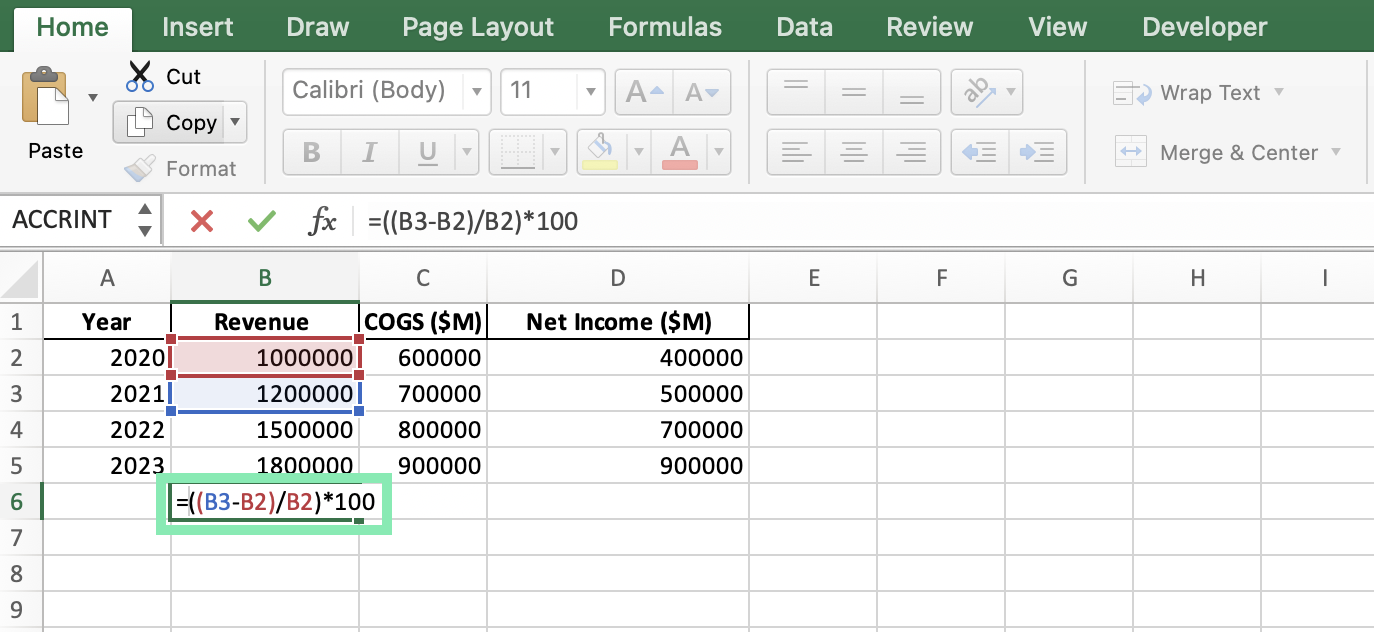
In the professional world, Excel is the gold standard for financial tools. To calculate the percentage difference between a value in cell A1 (Original) and B1 (New), the formula is:
=(B1-A1)/A1
Then, you simply format the cell as a percentage. This allows for the rapid processing of thousands of data points, enabling analysts to create dynamic charts that visualize growth trends over time.
Financial Calculators and Specialized Software
For real estate professionals and bankers, specialized handheld financial calculators (like the HP 12C) have dedicated buttons for percentage change (Δ%). Similarly, accounting software like QuickBooks or Xero automatically generates comparative balance sheets and profit/loss statements, providing the percentage difference between current and prior periods at the click of a button.
Automating Personal Finance
In the realm of personal finance, apps that track net worth or monthly spending rely on these calculations to show users their progress. If your “Dining Out” category grew by 40% this month while your income grew by 0%, the app uses the percentage difference to trigger a budget alert.
5. Critical Pitfalls: Avoiding Misinterpretations of Financial Data
Data can be deceptive if the context of the percentage difference is ignored. Financial literacy requires looking beyond the percentage to understand the underlying reality.
The “Small Base” Bias
One of the most common traps in financial reporting is the “low base effect.” If a startup increases its revenue from $1,000 to $10,000, it can claim a staggering 900% growth. Meanwhile, an established giant increasing revenue from $10 billion to $11 billion shows only 10% growth. In absolute terms, the giant created $1 billion in value, while the startup created only $9,000. Investors must be wary of high percentages that stem from insignificantly small starting figures.
Percentage Points vs. Percentages
This is a frequent source of confusion in financial news. If the central bank raises interest rates from 3% to 4%, they have raised rates by one percentage point, but the percentage difference in the cost of borrowing is 33.3%. Confusing these two can lead to massive errors in interest expense projections or mortgage planning.
The Impact of Inflation and “Real” vs. “Nominal” Change
When calculating the percentage difference in savings or wages over long periods, one must consider inflation. If you received a 5% raise (nominal difference) but inflation was 6% during that same period, your “real” purchasing power actually decreased by approximately 1%. Professional financial analysis always seeks to identify the “real” percentage difference to ensure that wealth is actually being built, rather than just appearing to grow on paper.
Conclusion
Calculating the percentage difference between two figures is more than a mathematical exercise; it is a vital lens for interpreting the movement of money. From the individual saver trying to beat inflation to the global CEO monitoring international market share, this calculation provides the clarity needed to make informed decisions. By mastering the formula, understanding its application in investments and business, and remaining vigilant against common data pitfalls, you can turn raw figures into a powerful roadmap for financial success. In the final analysis, it is not just about how much money you have, but how that money is moving, changing, and growing relative to your goals.
aViewFromTheCave is a participant in the Amazon Services LLC Associates Program, an affiliate advertising program designed to provide a means for sites to earn advertising fees by advertising and linking to Amazon.com. Amazon, the Amazon logo, AmazonSupply, and the AmazonSupply logo are trademarks of Amazon.com, Inc. or its affiliates. As an Amazon Associate we earn affiliate commissions from qualifying purchases.