In the realm of finance, numbers are the heartbeat of decision-making. Whether you are an individual investor tracking the performance of your portfolio, a business owner evaluating quarterly revenue shifts, or a financial analyst scrutinizing market trends, the ability to accurately calculate the percentage difference between two numbers is a non-negotiable skill.
Percentage difference is more than just a mathematical exercise; it is a lens through which we view growth, volatility, and sustainability. Understanding how to calculate and interpret these shifts allows you to move beyond raw data and uncover the narrative of your financial health. This guide provides a comprehensive breakdown of the methodology, its applications in wealth management, and the strategic implications of these calculations.

1. The Fundamental Formula for Financial Growth
Before diving into complex investment scenarios, one must master the basic mechanics of the percentage change formula. In financial terms, we are usually looking at the difference between a “prior value” and a “current value.”
Understanding the “New minus Old” Equation
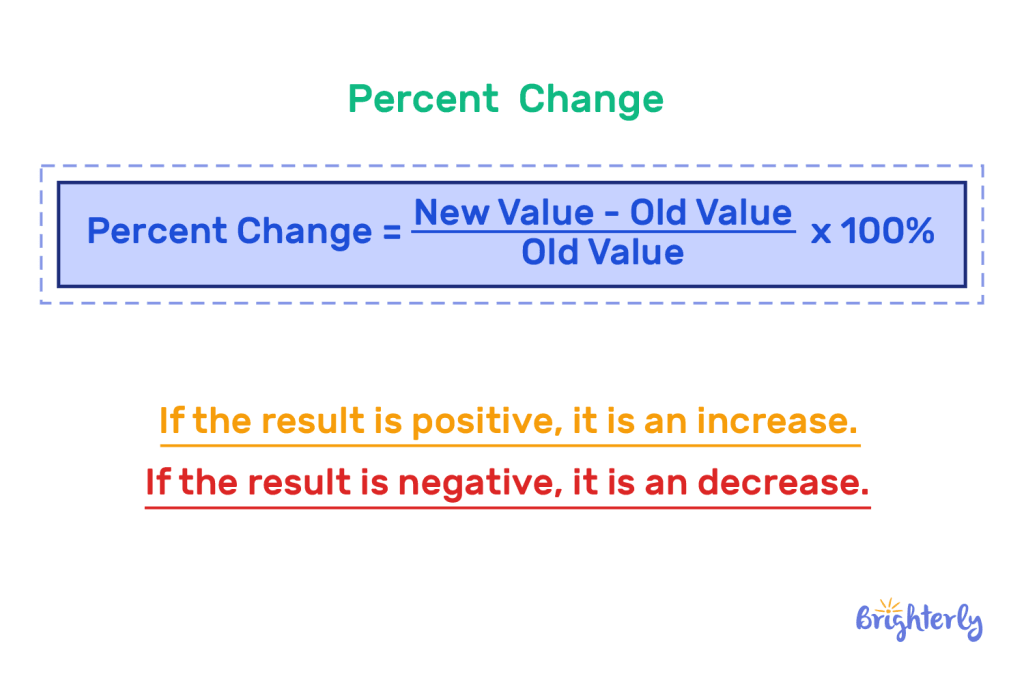
The standard formula for calculating the percentage difference (or percentage change) is:
Percentage Change = [(New Value – Old Value) / |Old Value|] × 100
In a monetary context, the “Old Value” represents your initial investment or previous period’s revenue, while the “New Value” represents the current standing.
For example, if you invested $5,000 in a mutual fund last year and it is now worth $6,200, the calculation would look like this:
- $6,200 (New) – $5,000 (Old) = $1,200 (Absolute Increase)
- $1,200 / $5,000 = 0.24
- 0.24 × 100 = 24%
This 24% represents your capital appreciation. Without converting the $1,200 gain into a percentage, it is difficult to compare this investment’s performance against other assets or inflation.
Avoiding the Common Pitfall of Percentage Points vs. Percent
A frequent error in financial reporting is confusing “percent” with “percentage points.” This distinction is critical when discussing interest rates or profit margins. If a bank raises its interest rate from 3% to 4%, the rate has increased by one percentage point, but the percentage difference is actually 33.3% (calculated as (4-3)/3). In professional finance, mislabeling these can lead to significant errors in projections and reporting.
2. Measuring Investment Performance and ROI
For the modern investor, the percentage difference is the primary metric for Return on Investment (ROI). It levels the playing field, allowing you to compare a high-priced stock with a penny stock on equal footing.
Calculating Gains and Losses in Your Portfolio
In personal finance, your portfolio is often a mix of various asset classes—stocks, bonds, real estate, and perhaps cryptocurrency. To understand which assets are pulling their weight, you must calculate the percentage difference for each over specific timeframes.
When an asset decreases in value, the formula remains the same, but the result is negative. For instance, if a cryptocurrency drops from $40,000 to $30,000, the calculation is ($30,000 – $40,000) / $40,000, resulting in a -25% change.
It is also important to note the “Recovery Paradox.” If an investment drops by 50%, it requires a 100% gain just to return to the original break-even point. Understanding this mathematical reality is crucial for risk management and setting stop-loss orders in a volatile market.
The Importance of Benchmarking Against Market Indices
Calculating your own percentage gain is only half the battle; the other half is context. If your portfolio grew by 10% over the last year, that might seem excellent. However, if the S&P 500 grew by 15% in the same period, your “relative” performance is actually trailing the market.
Professional wealth managers use percentage difference to calculate “Alpha,” which measures an investment’s performance relative to a benchmark index. By subtracting the market’s percentage growth from your own, you can determine whether your active management is actually adding value.
3. Business Finance: Profit Margins and Revenue Shifts
For business owners and corporate executives, percentage difference is the language of the “Bottom Line.” It is used to track growth trajectories and identify operational inefficiencies before they become catastrophic.
Tracking Month-over-Month (MoM) and Year-over-Year (YoY) Growth
Raw revenue figures can be deceptive due to seasonality. A retail business might see a 50% increase in revenue in December compared to November, which sounds impressive. However, by calculating the Year-over-Year (YoY) percentage difference—comparing December of this year to December of last year—the business owner can see if the company is truly growing or simply experiencing a standard seasonal surge.
YoY calculations smooth out the “noise” of monthly fluctuations and provide a clearer picture of long-term health. If your YoY revenue is up 10% but your YoY expenses are up 15%, your business is becoming less efficient despite making more money.
Analyzing Cost Fluctuations and Overhead Impact
The percentage difference formula is equally vital for expense management. In an inflationary environment, the cost of goods sold (COGS) can fluctuate rapidly.
If your raw material costs increase from $10.00 per unit to $11.50, that is a 15% increase in cost. If you do not adjust your pricing or find efficiencies elsewhere, that 15% increase directly eats into your profit margin. By calculating the percentage difference in overhead costs quarterly, businesses can identify “scope creep” and implement cost-cutting measures before profit margins are eroded entirely.
4. Advanced Metrics for Long-Term Wealth
While simple percentage difference is great for snapshots, long-term wealth building requires a more nuanced approach to mathematics.
The Role of Compound Annual Growth Rate (CAGR)
The simple percentage difference doesn’t account for the “compounding effect” over many years. If your investment grows by 10% in Year 1, drops by 5% in Year 2, and grows by 12% in Year 3, the total percentage difference from start to finish doesn’t tell you the steady rate at which your money grew.
This is where the Compound Annual Growth Rate (CAGR) comes in. CAGR provides a smoothed annual rate of return, which is essential for comparing investments with different lifespans. It answers the question: “What was the constant annual return that would have taken me from my starting balance to my ending balance?”
Adjusting for Inflation: Real vs. Nominal Returns
In the world of “Money,” not all gains are created equal. If your savings account offers a 4% annual interest rate (your nominal return), but the inflation rate for that year is 5%, your “Real Return” is actually -1%.
By calculating the percentage difference between your nominal gains and the Consumer Price Index (CPI), you can determine if your purchasing power is actually increasing. Strategic financial planning always prioritizes the “real” percentage difference to ensure that wealth isn’t just growing in terms of numbers, but in terms of what those numbers can actually buy.
5. Tools and Software for Financial Percentage Tracking
In the modern era, you don’t need to do these calculations on a napkin. Professional tools can automate this process, providing real-time insights into your financial standing.
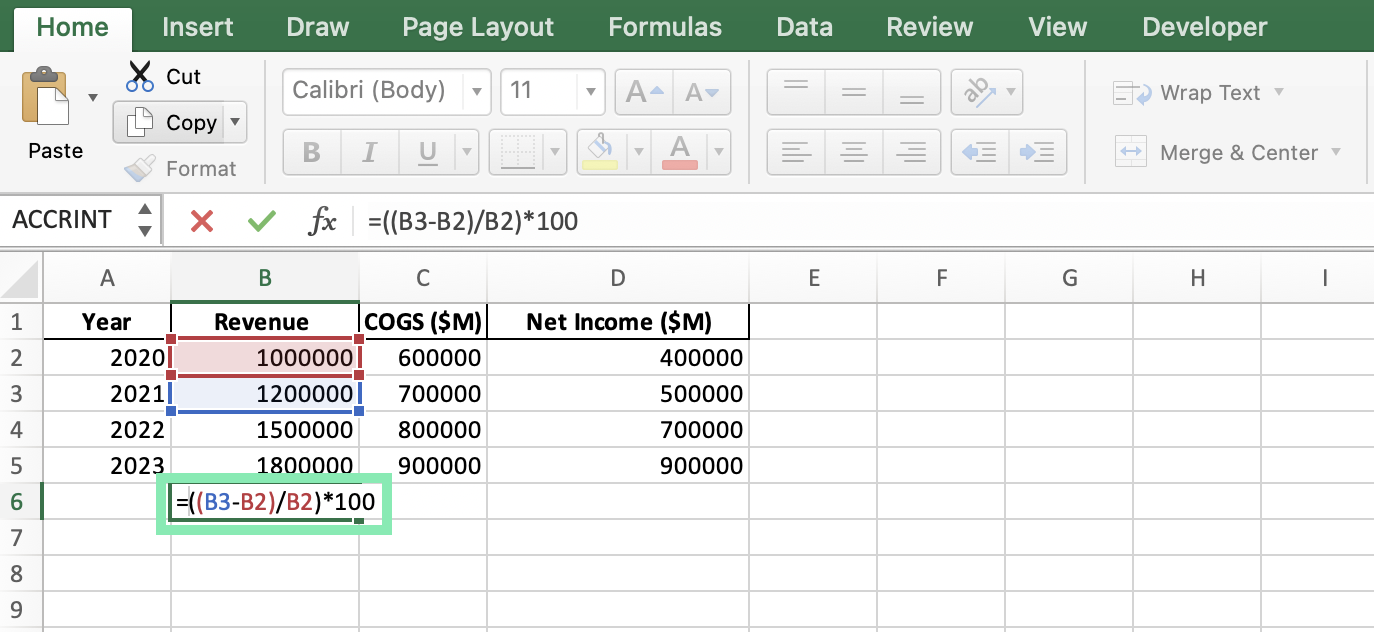
Excel and Google Sheets Automation
For most business applications, spreadsheets are the gold standard. Using a formula like =(B2-A2)/ABS(A2) allows you to drag a cell down and instantly calculate the percentage difference for hundreds of rows of data.
Advanced users utilize “Conditional Formatting” to highlight cells. For example, any percentage difference that is negative might automatically turn red, while gains above 5% turn green. This creates a “heat map” of financial performance, allowing managers to spot outliers instantly.
Financial Calculators and Investment Dashboards
For personal finance, apps like Mint, YNAB, or brokerage-specific dashboards (like those provided by Fidelity or Vanguard) do the heavy lifting for you. These tools often provide “time-weighted returns,” which is a sophisticated way of calculating percentage difference that accounts for the timing of your deposits and withdrawals.
When choosing a financial tool, ensure it allows you to customize the “base period.” Being able to toggle between a 1-day, 1-month, 1-year, and “All-Time” percentage difference is crucial for maintaining perspective. A 5% drop in a single day might feel like a crisis, but when viewed against a 50% “All-Time” gain, it becomes a minor correction in a larger growth story.
Conclusion
Calculating the percentage difference between two numbers is a fundamental pillar of financial literacy. It moves the conversation from “How much money did I make?” to “How effectively is my capital working for me?”
By mastering the basic formula, understanding the nuances of ROI, applying these metrics to business operations, and accounting for long-term factors like CAGR and inflation, you empower yourself to make data-driven financial decisions. In a world of fluctuating markets and economic uncertainty, the ability to quantify change is your most valuable asset. Whether you are scaling a corporation or building a retirement fund, remember: it’s not just about the numbers themselves, but the percentage of progress they represent.
aViewFromTheCave is a participant in the Amazon Services LLC Associates Program, an affiliate advertising program designed to provide a means for sites to earn advertising fees by advertising and linking to Amazon.com. Amazon, the Amazon logo, AmazonSupply, and the AmazonSupply logo are trademarks of Amazon.com, Inc. or its affiliates. As an Amazon Associate we earn affiliate commissions from qualifying purchases.