In the world of finance, numbers are more than just digits on a screen; they are the pulse of your economic health. Whether you are tracking the growth of a retirement portfolio, comparing the performance of two different business quarters, or analyzing the price fluctuation of a volatile asset, understanding the relationship between numbers is critical. One of the most fundamental tools in a financier’s or business owner’s arsenal is the ability to calculate the percentage difference.
While it may seem like a simple mathematical exercise, the “percentage difference” is often confused with “percentage change.” In a monetary context, knowing which to use and how to interpret the result can be the difference between a sound investment decision and a costly oversight. This guide will walk you through the precise methodologies of calculating percentage difference, its strategic applications in wealth management, and how to leverage these insights for long-term financial success.

Understanding the Core Logic: Difference vs. Change in Finance
Before diving into the formulas, it is essential to establish the linguistic and mathematical boundaries of this concept. In the financial sector, we frequently oscillate between two types of comparisons: percentage change and percentage difference.
The Definition of Percentage Difference
Percentage difference is typically used when you want to compare two values that belong to the same category but do not necessarily have a chronological order or a “baseline” vs. “new” relationship. For example, if you are comparing the annual returns of two different mutual funds, neither is the “original” value. You are simply looking for the relative gap between them.
The formula for percentage difference is:
|Value A – Value B| / [(Value A + Value B) / 2] × 100
In this equation, you take the absolute difference between the two numbers, divide it by their average, and multiply by 100. This provides a neutral comparison that shows how far apart the two figures are relative to their size.
Distinguishing Percentage Change
Conversely, percentage change is used when there is a clear “before” and “after.” This is the metric used for ROI (Return on Investment) or year-over-year (YoY) revenue growth.
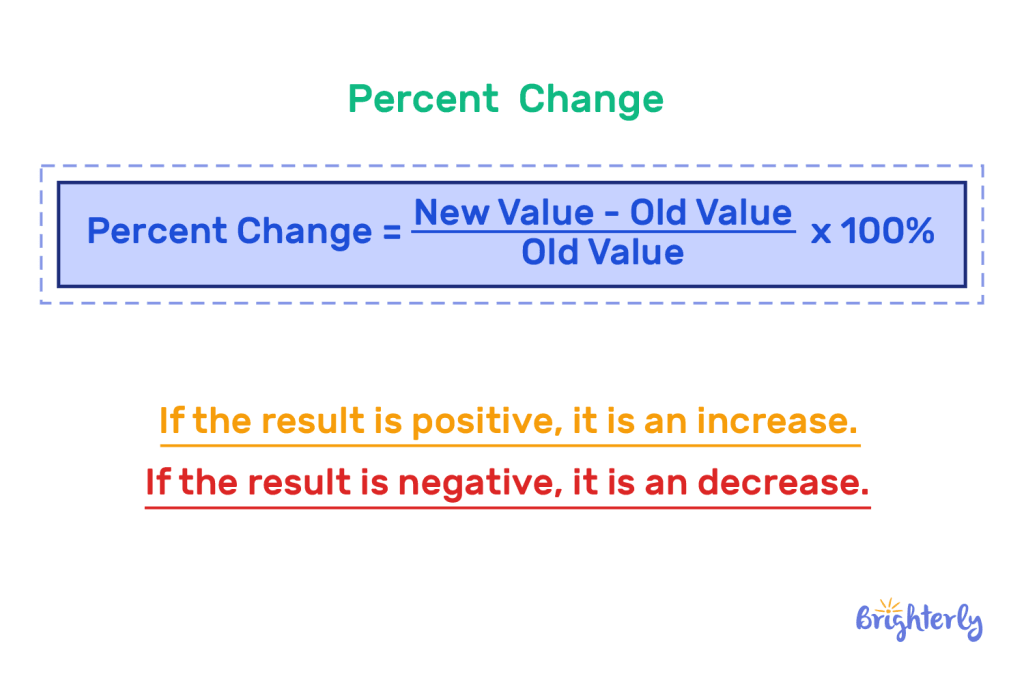
The formula for percentage change is:
(New Value – Old Value) / Old Value × 100
In personal finance and business accounting, mixing these two up can lead to skewed data. If you are a business owner comparing the sales performance of two different branch locations, the percentage difference is your go-to metric. If you are measuring the growth of one branch from January to December, you use percentage change.
Applying the Percentage Difference Formula in Personal Finance
Mastering this calculation allows individuals to move beyond “gut feelings” about their money and into the realm of data-driven budgeting. In personal finance, we often compare two competing options—two different savings accounts, two insurance premiums, or two mortgage rates.
Comparing High-Yield Savings and Investment Vehicles
Imagine you are deciding between two high-yield savings accounts. Bank A offers an interest rate of 4.2%, while Bank B offers 4.8%. At first glance, the 0.6% gap seems negligible. However, when you apply the percentage difference formula, you see the relative gap:
- Difference: 0.6
- Average: 4.5
- Result: 13.33%
By understanding that there is a 13.33% relative difference in the interest generated, a depositor can better appreciate the long-term compounding impact of that “small” 0.6% gap. Over a decade, that percentage difference translates into thousands of dollars in lost or gained wealth.
Analyzing Expense Discrepancies
Percentage difference is also a powerful tool for auditing your own lifestyle. If you spent $600 on groceries in March and $850 in April, calculating the difference relative to the average helps you understand the volatility of your spending habits. This “volatility check” is crucial for those working with a fixed income or those trying to optimize their “burn rate” while launching a side hustle. It helps identify outliers in spending that require immediate adjustment.
Strategic Business Growth: Tracking Discrepancies and Margins
In a corporate or entrepreneurial setting, the percentage difference serves as a Key Performance Indicator (KPI) for operational efficiency. It is used to identify gaps between projected budgets and actual spend, or to compare the performance of different product lines.
Budget Variance Analysis
Every successful business operates on a budget. At the end of a fiscal quarter, the finance team performs a variance analysis. If the projected cost for a marketing campaign was $10,000, but the actual cost was $12,500, the percentage difference (calculated against the average of the two) helps stakeholders understand the scale of the discrepancy relative to the total project size.
A high percentage difference indicates a lack of fiscal control or an unexpected market shift, whereas a low percentage difference suggests high forecasting accuracy. This is vital for “Lean” startups where every percentage point of capital must be accounted for to ensure a sufficient “runway.”
Competitor Benchmarking and Market Share
Business finance isn’t just about internal numbers; it’s about where you stand in the marketplace. If your company holds a 15% market share and your primary competitor holds 22%, the percentage difference between these two figures provides a clearer picture of the competitive gap than the simple 7-point spread.
By calculating the percentage difference, leadership can set more realistic targets for “closing the gap.” It moves the conversation from “we need more customers” to “we need to reduce the 37.8% relative performance gap between us and the market leader.”
Investment Analysis: Measuring Volatility and Asset Performance
For the modern investor, the ability to calculate and interpret percentage difference is the bedrock of risk management. Whether you are trading equities, cryptocurrencies, or real estate, you are constantly comparing “Number A” to “Number B.”
Evaluating Portfolio Diversification
A balanced portfolio often involves comparing the performance of different asset classes. For instance, an investor might compare the performance of their S&P 500 index fund against their Gold holdings. Because these assets have different price points and volatility scales, the percentage difference allows for a “normalized” comparison.
If the S&P 500 grew by 10% and Gold by 8%, the percentage difference (approx. 22.2%) tells the investor how much more efficient one asset was over the other during that specific period. This insight guides the “rebalancing” process—selling high-performing assets to buy underperforming ones to maintain a target risk profile.
Real Estate: Comparing Cap Rates
In real estate investing, “Cap Rate” (Capitalization Rate) is a fundamental metric used to estimate the potential return on an investment property. When comparing two properties—Property A with a 5% cap rate and Property B with a 6.5% cap rate—the percentage difference formula highlights the relative risk-reward profile.
While a 1.5% difference sounds small, the percentage difference is roughly 26%. This indicates that Property B is significantly more “productive” in terms of cash flow relative to its price, though it might also carry 26% more relative risk.
Leveraging Digital Tools for Financial Calculations
In the digital age, while it is important to understand the manual math, speed and accuracy are best achieved through technology. Financial analysts and savvy personal investors use a variety of tools to automate these calculations.
Excel and Google Sheets: The Financier’s Powerhouses
Spreadsheets are the gold standard for financial modeling. To calculate percentage difference in Excel, you don’t need a pre-built function; you simply input the formula.
- If Value A is in cell A1 and Value B is in cell B1, the formula is:
=ABS(A1-B1)/((A1+B1)/2) - Then, format the cell as a “Percentage.”
This allows for dynamic tracking. As stock prices or monthly revenues change, the spreadsheet updates automatically, providing a real-time view of financial health.
Fintech Apps and Dashboards
Modern personal finance apps like Mint, YNAB (You Need A Budget), or sophisticated trading platforms like Bloomberg Terminal and Robinhood, often do this math behind the scenes. They provide “Comparative Analytics” dashboards that show you the percentage difference in your net worth month-over-month or your spending across different categories.
However, the user must still be able to interpret these percentages. A 50% difference in “Entertainment” spending might be less concerning than a 5% difference in “Mortgage/Interest” costs. Knowing the math allows you to prioritize which numbers deserve your attention and which are merely “noise.”

Conclusion: The Power of Relative Math in Wealth Building
Calculating the percentage difference is more than an academic exercise; it is a vital skill for anyone looking to master their financial destiny. It provides a neutral, objective lens through which to view discrepancies, gaps, and relative performance.
By distinguishing between percentage change (growth) and percentage difference (comparison), you gain a more nuanced understanding of your ROI, your business margins, and your investment risks. In an economy where every basis point counts, being able to accurately “figure out the difference” ensures that you are not just working for your money, but that your money—and your data—is working for you. Precision in calculation leads to confidence in decision-making, and in the world of money, confidence is the ultimate currency.
aViewFromTheCave is a participant in the Amazon Services LLC Associates Program, an affiliate advertising program designed to provide a means for sites to earn advertising fees by advertising and linking to Amazon.com. Amazon, the Amazon logo, AmazonSupply, and the AmazonSupply logo are trademarks of Amazon.com, Inc. or its affiliates. As an Amazon Associate we earn affiliate commissions from qualifying purchases.