
In the intricate world of technology, where systems grow increasingly complex and user interactions demand seamless predictability, understanding how a system behaves dynamically is paramount. This is where the humble yet powerful “state diagram” steps in. Far from being a mere theoretical construct, state diagrams are an indispensable visual modeling tool used by software engineers, system architects, and various technical professionals to represent the behavior of a system or an object in response to events. At its core, a state diagram illustrates the various “states” a system can be in, the “events” that trigger transitions between these states, and the “actions” performed during these transitions or within a state.
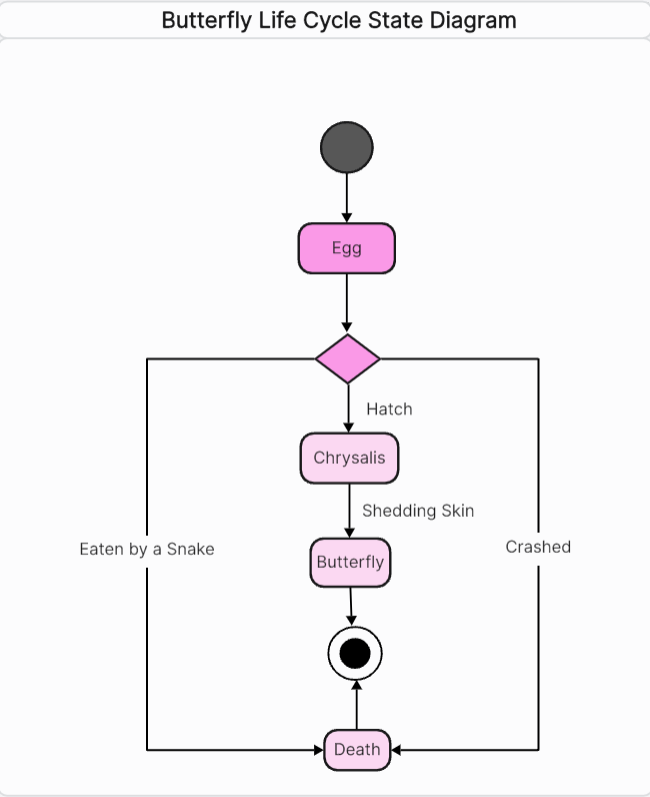
Imagine a simple traffic light. It’s not always green; it cycles through red, yellow, and green based on a timer or sensor input. Each of these colors represents a “state,” and the change from one color to another is a “transition,” triggered by an “event” (e.g., timer expiry). A state diagram provides a clear, unambiguous map of all such possible states and transitions, making it easier to design, analyze, and debug complex systems. It’s a fundamental concept in areas like embedded systems, user interface design, network protocols, and any software where the system’s response depends on its current condition and incoming stimuli.
The Fundamentals of State Diagrams
To truly harness the power of state diagrams, it’s essential to grasp their core components and the logic that governs their construction. These diagrams provide a standardized way to visualize dynamic behavior, helping teams communicate more effectively and build more robust applications.
Core Components: States, Transitions, and Events
The architectural foundation of any state diagram rests upon three primary elements: states, transitions, and events. Understanding their individual roles and how they interact is crucial for accurate modeling.
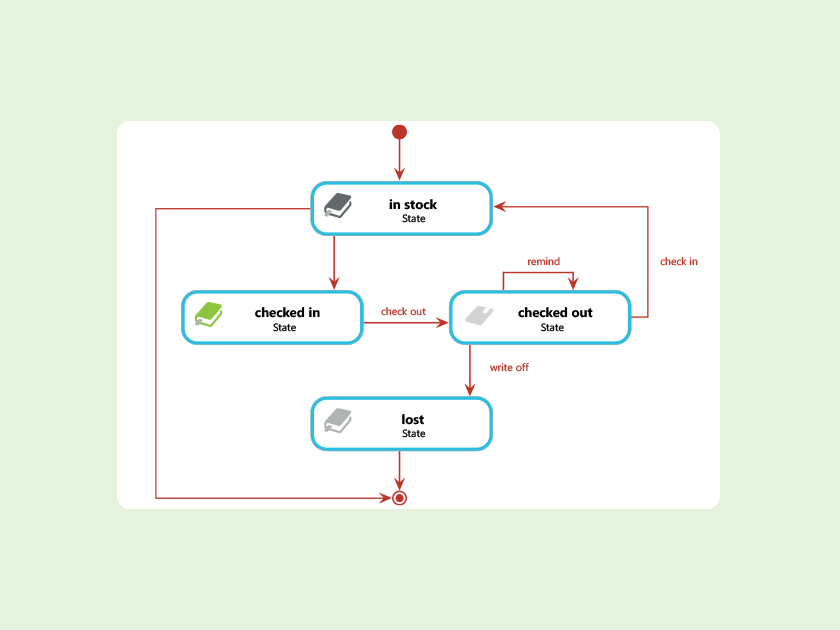
- States: A state represents a distinct condition or mode that an object or system can be in at a given moment. Think of it as a snapshot of the system’s status, waiting for something to happen. In a traffic light system, “Red,” “Yellow,” and “Green” are states. In a user application, “Logged In,” “Logged Out,” “Editing Profile,” or “Waiting for Data” could be states. States are typically drawn as rounded rectangles, containing the state’s name and potentially internal actions. While in a state, the system exhibits certain properties or behaviors and may perform specific activities (e.g., “displaying data” while in the “Viewing Profile” state).
- Transitions: A transition signifies a change from one state to another. It’s the movement or pathway taken when an event occurs, causing the system to leave its current state and enter a new one. Transitions are depicted as directed arrows originating from the source state and pointing to the target state. The arrow is often labeled with the event that triggers the transition and, optionally, any actions performed during that transition. For instance, an arrow from “Red” to “Green” in a traffic light might be labeled “Timer expires / change light.”
- Events: An event is an occurrence that triggers a transition from one state to another. Events are the catalysts for change in a stateful system. They can originate from external sources (e.g., user input like “button click,” sensor data like “temperature exceeds threshold”) or internal sources (e.g., “timer expires,” “data processed”). An event’s arrival can cause the system to react by performing actions and potentially changing its state, provided the conditions for that transition are met.
Initial and Final States
Beyond the core components, state diagrams also incorporate specific markers to denote the beginning and end of a system’s lifecycle:
- Initial State (Start State): Represented by a solid black circle, the initial state indicates where the system or object begins its execution or lifecycle. Every complete state diagram should have exactly one initial state, signifying the entry point into the modeled behavior. From this initial state, a transition (often unlabeled, representing an automatic start) leads to the first operational state of the system.
- Final State (End State): Depicted as a black circle surrounded by another circle, a final state (or terminate state) indicates the termination of the system’s behavior. While an initial state is mandatory, a final state is optional, as many systems are designed to run continuously or loop indefinitely (e.g., an operating system, a server application). When a system reaches a final state, its execution ceases or that particular behavior path concludes.
Guards and Activities
To refine the logic and add more granular control to state transitions and state behavior, state diagrams incorporate guards and activities:
- Guards: A guard is a boolean condition that must be true for a transition to fire after its triggering event has occurred. Guards provide a way to specify conditional transitions, ensuring that a state change only happens when specific criteria are met. For example, a transition labeled “button click [password_valid]” means the transition only occurs if a “button click” event happens and the
password_validcondition evaluates to true. Guards are placed in square brackets[]next to the event label on a transition. - Activities (Actions): Actions are atomic operations performed either during a transition or while a system is in a particular state. They describe what the system does in response to an event or while maintaining a state. There are several types:
- Entry Actions: Actions performed immediately upon entering a state.
- Exit Actions: Actions performed just before leaving a state.
- Do Activities: Continuous activities performed while the system is in a state.
- Transition Actions: Actions performed during the transition itself, after the event and guard condition have been met, but before entering the target state. Actions are typically denoted after a forward slash
/on a transition label (e.g., “event [guard] / action”).
Why State Diagrams Are Indispensable in Tech
State diagrams are not just theoretical constructs for academics; they are practical, powerful tools that provide immense value across the technology landscape, from conceptual design to post-deployment maintenance. Their visual nature and rigorous logic make them an invaluable asset for any development team.
Clarifying Complex System Behavior
One of the primary advantages of state diagrams is their ability to simplify and clarify the behavior of complex systems. Modern software and hardware often involve numerous interacting components, each with its own internal logic. Without a clear visual representation, understanding how these components behave under different conditions and respond to various inputs can be incredibly challenging, leading to misinterpretations and design flaws.
State diagrams provide a bird’s-eye view, breaking down intricate sequences of operations into discrete, manageable states and explicit transitions. This visual clarity helps identify all possible scenarios, including edge cases and error conditions that might otherwise be overlooked. By mapping out every potential path a system can take, designers can ensure robust error handling and predictable operation, significantly reducing ambiguity in system specifications.
Facilitating Communication and Collaboration
In a typical tech project, multiple stakeholders—developers, testers, product managers, business analysts, and even clients—need to understand the system’s behavior. Text-based requirements documents, while comprehensive, can often be dense and open to varied interpretations. State diagrams act as a universal visual language that bridges these communication gaps.
A well-crafted state diagram offers a common reference point that all team members can understand, regardless of their specific technical background. It makes it easier to discuss proposed changes, identify potential issues, and ensure everyone is on the same page regarding how the system should react in different situations. This collaborative power fosters better teamwork, reduces misunderstandings, and accelerates the development process.
Improving Design, Testing, and Debugging
The benefits of state diagrams extend well into the development lifecycle, profoundly impacting design quality, testing thoroughness, and debugging efficiency.
- Design: During the design phase, state diagrams help identify redundancies, unreachable states, and potential deadlocks or infinite loops. By visualizing the flow, designers can optimize state transitions, streamline logic, and ensure the system behaves efficiently and correctly under all expected conditions.
- Testing: State diagrams are a goldmine for testers. They provide a systematic basis for generating comprehensive test cases. Testers can use the diagram to identify all possible paths through the system, ensuring that every state and every transition is covered by test scenarios. This state-based testing approach helps uncover bugs related to incorrect state transitions, unexpected system behavior, or overlooked edge cases, leading to higher-quality software.
- Debugging: When a system exhibits unexpected behavior, a state diagram can be an invaluable debugging aid. Developers can trace the actual execution path against the modeled diagram to pinpoint exactly where the system deviated from its intended behavior. This visual comparison significantly speeds up the identification and resolution of bugs, reducing downtime and development costs.
Applications Across Diverse Fields
The utility of state diagrams is not confined to a single domain within technology. Their ability to model dynamic behavior makes them applicable across a wide spectrum of fields:
- Software Development: Essential for modeling user interface behavior, embedded systems (e.g., firmware for IoT devices), communication protocols, workflow engines, and object lifecycles in object-oriented programming.
- Hardware Design: Crucial for designing digital circuits, control units, and finite state machines in fields like electronics engineering.
- Business Process Modeling: Can be used to model the states of a business entity (e.g., “Order Placed,” “Order Shipped,” “Order Delivered”) and the events that trigger changes in its status.
- Game Development: For modeling character AI, game states (e.g., “Playing,” “Paused,” “Game Over”), and quest progression.
Types and Notations: A Deeper Dive
While the core concepts of states, transitions, and events remain consistent, various formalisms and notations exist for state diagrams, each with its nuances and typical application areas.
UML State Machine Diagrams
By far the most widely adopted and recognized standard in software engineering, UML (Unified Modeling Language) State Machine Diagrams provide a rich and expressive notation for modeling the dynamic behavior of systems and objects. UML state machines are powerful because they extend basic state diagrams with advanced features, making them suitable for modeling highly complex systems:
- Nested States (Composite States): A state can contain substates, allowing for hierarchical modeling. This helps manage complexity by abstracting details within a higher-level state. For example, an “Online” state might contain “Idle,” “Active,” and “Offline” substates.
- History States: A history state allows a system to remember its most recently active substate within a composite state, so that when it re-enters the composite state, it returns to that remembered substate. This is particularly useful for user interfaces where users might navigate away and return to the same point.
- Concurrent Regions (Orthogonal Regions): A state can be divided into two or more regions that execute concurrently. This is useful for modeling systems where multiple independent activities happen simultaneously within the same high-level state.
- Entry/Exit Points: Pseudo-states that allow specific entry or exit points within a composite state, providing more control over how states are entered and exited.
UML’s preference stems from its standardization, extensive tooling support across various IDEs and diagramming software, and its comprehensive nature, which allows it to model virtually any system behavior accurately.
Other Notations (Brief Mention)
While UML state machines are dominant, it’s worth briefly mentioning other important notations that have influenced or serve specific niches:
- Mealy and Moore Machines: These are foundational concepts in theoretical computer science and digital logic design. They are simpler finite state machines where outputs are associated with either transitions (Mealy) or states (Moore). They are primarily used in contexts like hardware design and automata theory.
- Harel Statecharts: Developed by David Harel, statecharts significantly influenced UML state machine diagrams. Harel introduced key concepts like hierarchy (nested states), concurrency, and broadcast communication, which were revolutionary for modeling complex reactive systems. While UML State Machines are the practical application, Harel’s work laid much of the theoretical groundwork.
Best Practices for Effective State Diagramming
Crafting effective state diagrams requires more than just understanding the notation; it demands a thoughtful approach to modeling, clear communication, and iterative refinement. Adhering to best practices ensures your state diagrams truly serve their purpose: clarity, robustness, and maintainability.
Keep It Focused and Modular
One of the biggest pitfalls in state diagramming is trying to model too much detail in a single diagram, leading to an overly complex, unreadable “spaghetti chart.” Instead:
- Model specific aspects: Focus each diagram on a particular object or a specific, well-defined aspect of a system’s behavior. For instance, model the lifecycle of an “Order” object in one diagram and the behavior of a “User Interface Widget” in another.
- Utilize nesting (composite states): For complex behaviors, leverage UML’s composite states to encapsulate substates and their transitions within a higher-level state. This allows you to hide intricate details, making the high-level view cleaner and more understandable, while allowing deeper dives into specific components.
- Break down large systems: For very large and complex systems, consider creating multiple, interconnected state diagrams, each representing a module or component, and showing how they interact.
Name States and Transitions Clearly
Clarity is paramount. Ambiguous naming can negate all the benefits of visual modeling.
- Descriptive State Names: Each state should have a clear, concise, and descriptive name that accurately reflects the condition of the system or object while in that state (e.g., “Authenticating,” “Idle,” “Waiting For User Input,” “Payment Processing”).
- Event-Driven Transition Labels: Transition labels should clearly indicate the event that triggers the transition, and optionally, any guards or actions. Use active verbs where appropriate for events (e.g., “userclickslogin,” “timeoutoccurs,” “datareceived”).
- Consistent Terminology: Use consistent terminology throughout your diagram and across related documentation.
Validate and Iterate
State diagrams are living documents that should evolve with your system.
- Review with Stakeholders: Always review your state diagrams with developers, testers, product managers, and even end-users or clients. Their feedback is invaluable for catching misunderstandings, overlooked scenarios, or incorrect assumptions.
- Test the Logic: Mentally (or actually) “walk through” the diagram with various use cases, including normal flows, alternative paths, and error scenarios. Does the system behave as expected? Are there any unreachable states or unintended loops?
- Refine as Requirements Evolve: As system requirements change, so too should your state diagrams. Keep them updated to reflect the current behavior, ensuring they remain a valuable and accurate source of truth.
Utilize Tools
While simple state diagrams can be sketched on a whiteboard, professional development benefits greatly from dedicated diagramming tools.
- Diagramming Software: Tools like draw.io (now diagrams.net), Lucidchart, Miro, or Microsoft Visio offer intuitive interfaces for creating and managing state diagrams, often with built-in UML templates.
- Code-Based Diagramming: Tools like PlantUML or Mermaid allow you to generate diagrams from simple text descriptions, which can be version-controlled alongside your code. This is particularly useful for developers who prefer a “diagrams-as-code” approach.
- IDE Integrations: Many Integrated Development Environments (IDEs) offer plugins or built-in support for generating or visualizing state diagrams directly from code or specialized modeling languages.
By embracing these best practices, you can transform state diagrams from mere visual aids into powerful, communicative, and actionable artifacts that significantly contribute to the success of your tech projects.

Conclusion
In the dynamic landscape of modern technology, where systems are increasingly complex and user expectations for reliability are higher than ever, the “what is state diagram” question unveils a critical tool for success. State diagrams are far more than just pretty pictures; they are rigorous, insightful, and incredibly practical visual models for understanding, designing, and maintaining systems that exhibit dynamic behavior.
From the simple cycling of a traffic light to the intricate workflows of an enterprise application, state diagrams provide unparalleled clarity. They empower developers to clarify complex logic, foster seamless communication among diverse teams, and significantly enhance the quality of software and hardware by improving design, streamlining testing, and accelerating the debugging process. The adoption of standardized notations like UML State Machine Diagrams further amplifies their power, providing a rich vocabulary for even the most sophisticated systems.
By adhering to best practices—keeping diagrams focused, using clear nomenclature, embracing iterative refinement, and leveraging appropriate tools—tech professionals can harness the full potential of state diagrams. They are an indispensable asset for anyone committed to building robust, predictable, and maintainable systems in an ever-evolving technological world. As systems continue to grow in complexity, the fundamental principles and visual power of state diagrams will remain a cornerstone of effective engineering.
aViewFromTheCave is a participant in the Amazon Services LLC Associates Program, an affiliate advertising program designed to provide a means for sites to earn advertising fees by advertising and linking to Amazon.com. Amazon, the Amazon logo, AmazonSupply, and the AmazonSupply logo are trademarks of Amazon.com, Inc. or its affiliates. As an Amazon Associate we earn affiliate commissions from qualifying purchases.