In the fast-paced world of finance, the question “What is the stock market doing today?” is more than just a query about whether the numbers on a screen are green or red. It is a search for understanding the underlying narrative of the global economy. For the modern investor, daily fluctuations represent a confluence of geopolitical events, corporate earnings reports, and shifts in monetary policy.
Understanding today’s market requires looking beyond the immediate price action of the Dow Jones Industrial Average or the S&P 500. It involves dissecting the sentiment of traders, the behavior of institutional “smart money,” and the macroeconomic signals that dictate the flow of capital. This article provides an in-depth analysis of the factors currently driving market movements and how investors can interpret these signals to make informed decisions.
1. Decoding Market Sentiment and Key Performance Indicators
To answer what the market is doing today, one must first look at the major indices and the “fear gauges” that dictate investor behavior. The market is not a monolith; it is a collection of various sectors that often move in different directions based on specific catalysts.
The Role of Major Indices: S&P 500, Dow, and Nasdaq
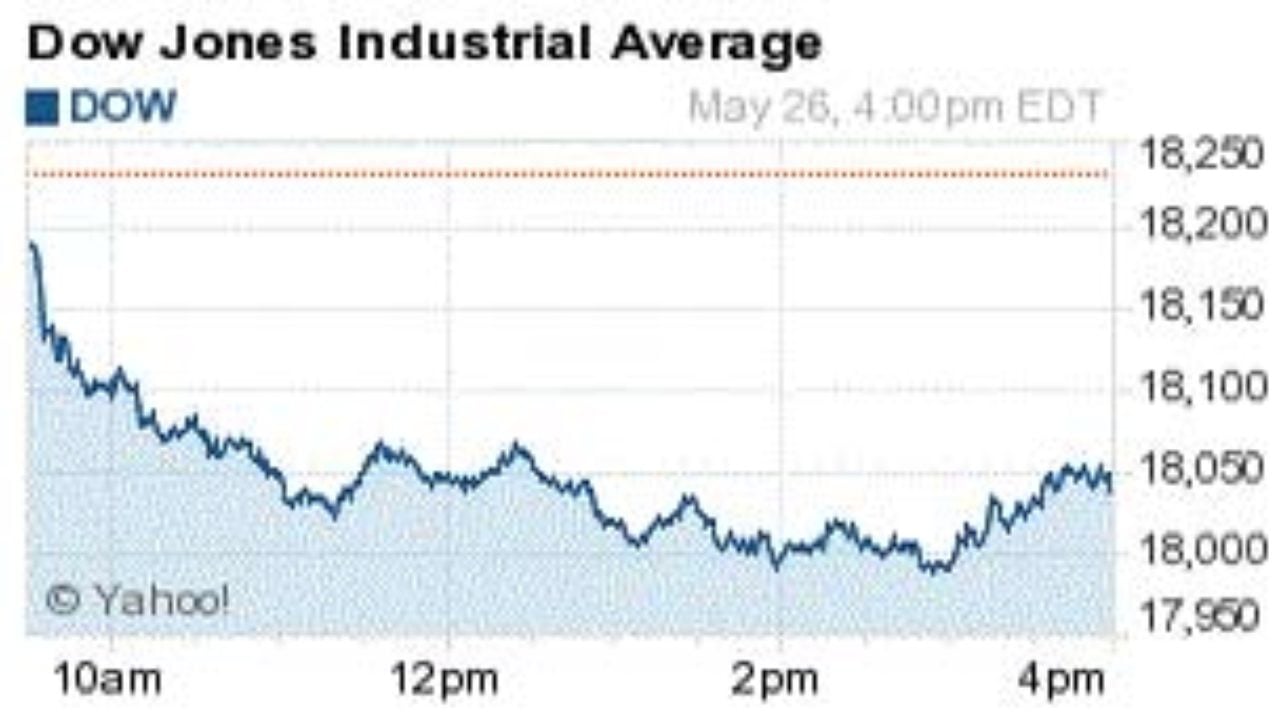
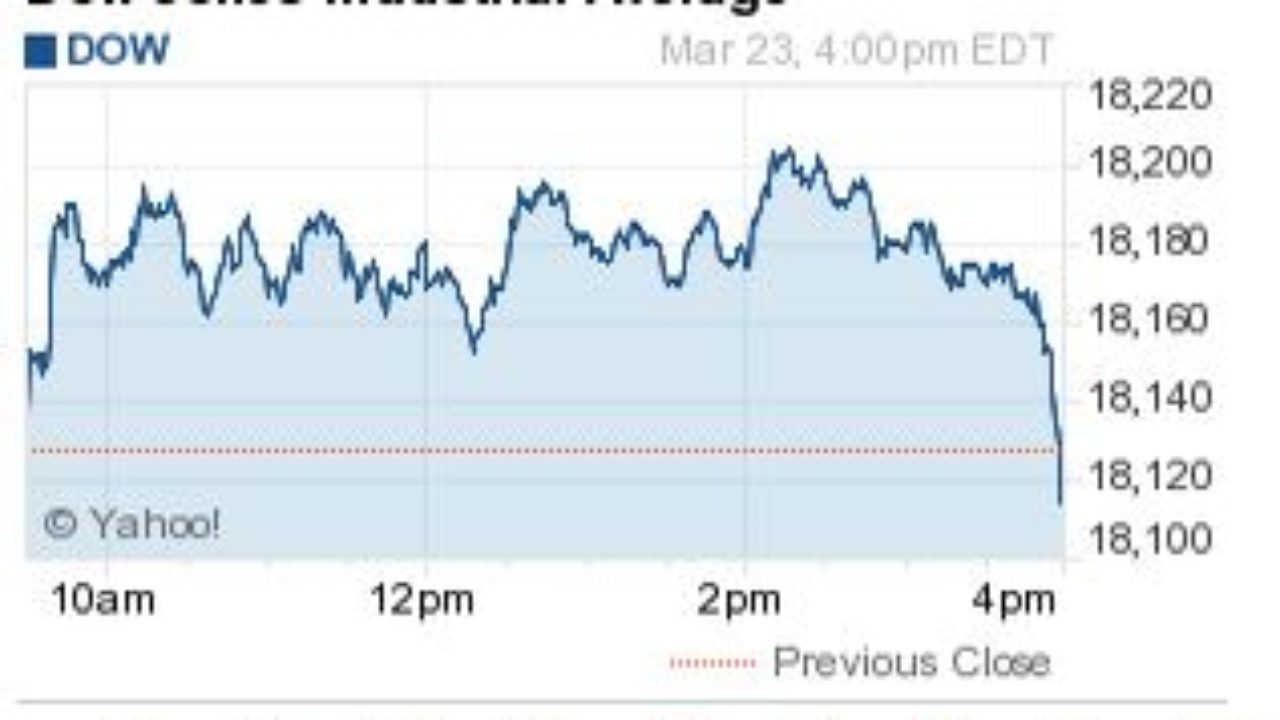
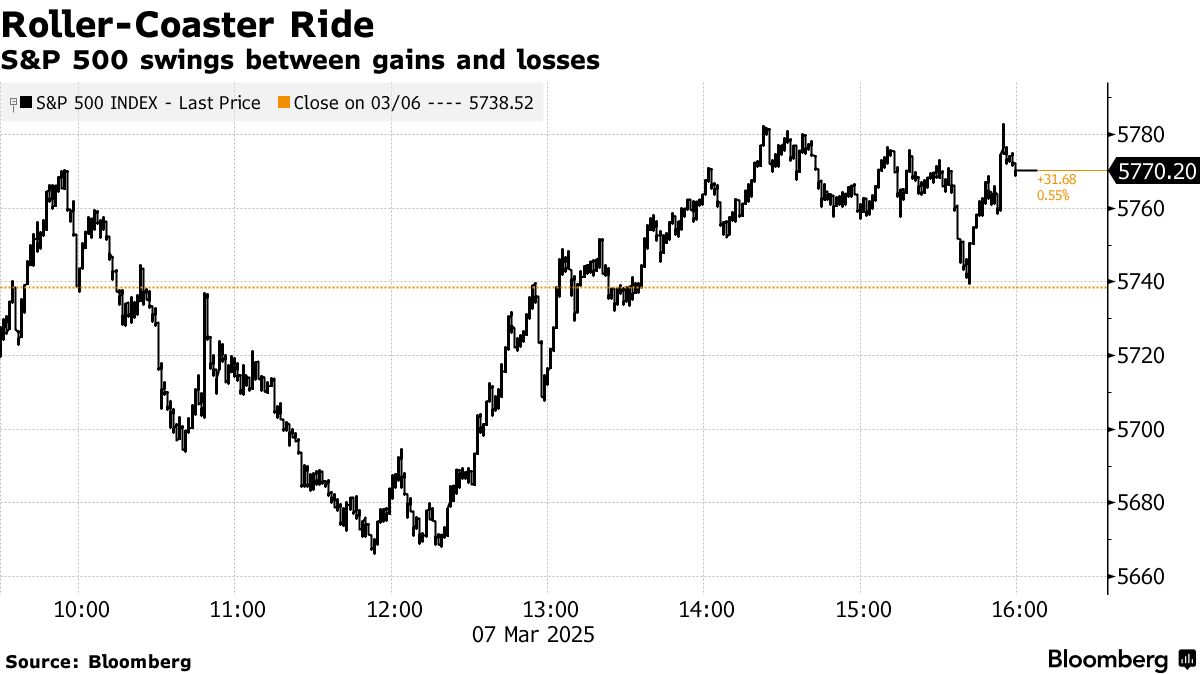
The S&P 500 is often considered the most accurate representation of the US stock market, tracking the performance of 500 of the largest publicly traded companies. When people ask what the market is doing, they are usually referring to the S&P 500’s movement. Meanwhile, the Nasdaq Composite, heavily weighted toward technology, reflects the market’s appetite for growth and innovation. Conversely, the Dow Jones Industrial Average offers a glimpse into “blue-chip” stability. Observing the divergence between these three can tell you if investors are seeking safety in established giants or taking risks in high-growth tech sectors.
Understanding Market Breadth
Market breadth refers to how many individual stocks are participating in a market move. If the S&P 500 is up, but only five major tech stocks are driving those gains while the other 495 are flat or down, the market is “top-heavy.” This suggests a lack of broad-based confidence. Today’s market participants closely watch the “Advance-Decline Line” to see if a rally is sustainable or if it is a fragile movement driven by a handful of outliers.
The VIX: The Market’s Fear Gauge
The CBOE Volatility Index, or VIX, measures the market’s expectation of 30-day volatility. A high VIX indicates that investors are nervous and paying more for “insurance” via options. When the market is calm, the VIX typically hovers at lower levels. Monitoring the VIX in real-time provides immediate context to whether a downward move in the stock market is a controlled correction or the beginning of a panic-driven sell-off.
2. Macroeconomic Drivers: The Forces Behind the Daily Fluctuations
The stock market does not exist in a vacuum. It is heavily influenced by “macro” factors—large-scale economic trends that dictate the cost of borrowing and the purchasing power of consumers.
The Federal Reserve and Interest Rate Cycles
Perhaps the single most influential factor in today’s market is the Federal Reserve’s stance on interest rates. When the Fed raises rates to combat inflation, borrowing becomes more expensive for companies, which can squeeze profit margins and lower stock valuations. Today’s investors are hyper-fixated on “Fed speak”—the public comments made by central bank officials—searching for clues on whether the next move will be a rate hike, a pause, or a cut.
Inflation Data: CPI and PPI Reports
Consumer Price Index (CPI) and Producer Price Index (PPI) releases are high-volatility events for the stock market. If inflation comes in higher than expected, the market often reacts negatively, fearing that the Fed will keep rates high for longer. Conversely, “cooling” inflation data can spark a rally as investors anticipate a more accommodative monetary environment. Understanding today’s market requires knowing where we stand in the current inflation cycle.
Geopolitical Stability and Energy Costs
Global events, from trade tensions to regional conflicts, have a direct impact on market volatility. These events often manifest in the price of oil and natural gas. Since energy is a primary input for almost every industry, rising energy costs act as a “tax” on both corporations and consumers. On days when the market seems inexplicably volatile, the cause can often be traced to a geopolitical development affecting global supply chains.
3. Sector Performance and the Rotation of Capital
Money in the stock market is constantly moving. Institutional investors rarely pull all their money out; instead, they “rotate” from one sector to another based on the economic outlook.
Growth vs. Value: The Perpetual Tug-of-War
Growth stocks, primarily in the technology and biotech sectors, thrive when interest rates are low and economic expansion is high. Value stocks—companies that are considered undervalued relative to their fundamentals—often perform better during periods of economic recovery or high interest rates. Today’s market action often shows a rotation where investors sell “expensive” growth stocks to lock in profits and move that capital into “defensive” value stocks like utilities or consumer staples.
The Influence of the Artificial Intelligence Boom
In the current market cycle, the technology sector has been dominated by developments in Artificial Intelligence (AI). A few key players in the semiconductor and software industries have accounted for a disproportionate amount of market gains. When assessing what the market is doing today, one must consider if the “AI trade” is continuing to lead the charge or if investors are beginning to question the immediate Return on Investment (ROI) of these massive tech expenditures.
Dividend Stocks as a Safe Haven
When market volatility increases, many investors flee to dividend-yielding stocks. These companies, often in the healthcare, telecommunications, or real estate sectors, provide a steady stream of income regardless of the stock’s price movement. Observing a surge in these sectors is a classic sign that the market is adopting a “risk-off” posture, where preservation of capital becomes the priority over aggressive growth.
4. Investment Strategies for Navigating Volatility
Knowing what the market is doing today is only useful if you have a strategy to act on that information. The best investors distinguish between “market noise” and “market signals.”
The Power of Dollar-Cost Averaging (DCA)
For the long-term investor, the daily “noise” of the market should be secondary to a consistent investment plan. Dollar-cost averaging—investing a fixed amount of money at regular intervals regardless of the price—removes the emotional burden of trying to “time” the market. On days when the market is down significantly, DCA allows you to buy more shares at a lower price, lowering your average cost basis over time.
Rebalancing and Portfolio Diversification
A “green” day in the market might push your stock holdings to represent a larger percentage of your portfolio than you originally intended. Professional wealth management involves periodic rebalancing—selling a portion of your winners to buy assets that may have underperformed but still have strong fundamentals. This ensures that you are consistently “buying low and selling high” without even realizing it.
Emotional Discipline and the Long-Term Horizon
The greatest enemy of the individual investor is often their own psychology. On days when the market is “doing” something drastic—like a 2% drop in a single session—the urge to sell can be overwhelming. However, history shows that the market’s best days often follow its worst. Maintaining a long-term perspective and sticking to a well-researched financial plan is the hallmark of successful investing.
5. Essential Tools for Real-Time Market Analysis
To stay ahead of what the stock market is doing, you need access to the right data and tools. Modern technology has democratized financial information, giving retail investors many of the same advantages as Wall Street pros.
Financial News Aggregators and Terminals
While most people don’t need a $24,000-a-year Bloomberg Terminal, tools like Yahoo Finance, CNBC, and MarketWatch provide real-time updates on price action and breaking news. Setting up “watchlists” for specific sectors allows you to see at a glance which parts of the economy are leading or lagging on any given day.
Technical Analysis and Charting Software
For those interested in the “how” and “when” of market movements, technical analysis tools like TradingView provide insights into price patterns, support and resistance levels, and moving averages. While fundamental analysis tells you what to buy, technical analysis helps you understand when the market sentiment is shifting, allowing for better entry and exit points.
Economic Calendars and Earnings Reports
A savvy investor keeps an eye on the economic calendar. Knowing when the next jobs report is due or when a major company like Apple or Microsoft is reporting earnings can help you anticipate market volatility. These events often act as “binary” catalysts—the market will either jump or dive based on whether the data meets or misses expectations.
In conclusion, “what the stock market is doing today” is a complex story of human psychology, global economics, and corporate performance. By understanding the indices, monitoring the Fed, watching sector rotations, and maintaining a disciplined strategy, you can move from being a passive observer to an active, informed participant in the world of finance. Whether the market is up or down, every day presents a new opportunity to refine your portfolio and move closer to your long-term financial goals.
aViewFromTheCave is a participant in the Amazon Services LLC Associates Program, an affiliate advertising program designed to provide a means for sites to earn advertising fees by advertising and linking to Amazon.com. Amazon, the Amazon logo, AmazonSupply, and the AmazonSupply logo are trademarks of Amazon.com, Inc. or its affiliates. As an Amazon Associate we earn affiliate commissions from qualifying purchases.