
In the realms of personal finance, corporate accounting, and wealth management, the ability to calculate and interpret a percentage increase is more than a simple mathematical exercise; it is a fundamental skill for evaluating success. Whether you are tracking the growth of a brokerage account, analyzing year-over-year revenue for a startup, or assessing the impact of inflation on your purchasing power, understanding the “how” and “why” behind percent increases allows for data-driven decision-making.
Percentages provide a universal language for comparison. While absolute dollar amounts tell you the scale of a change, percentages reveal the velocity and efficiency of that change. A $1,000 gain on a $5,000 investment is vastly different from a $1,000 gain on a $1,000,000 portfolio. By mastering the calculation of percent increases, you gain the clarity necessary to navigate the complexities of the modern financial landscape.
The Fundamental Formula: Understanding Growth Dynamics
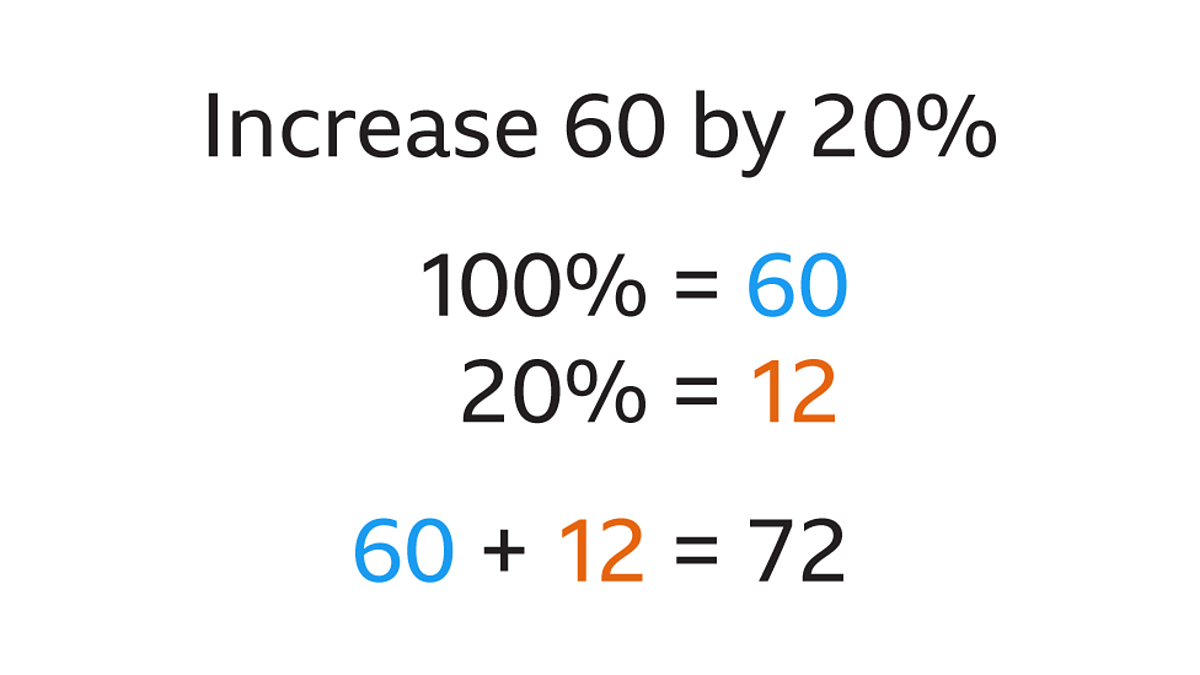
To calculate a percent increase, you must follow a logical sequence that isolates the change in value relative to the starting point. The formula is straightforward, yet its implications are profound across all financial sectors.
The Basic Calculation Step-by-Step
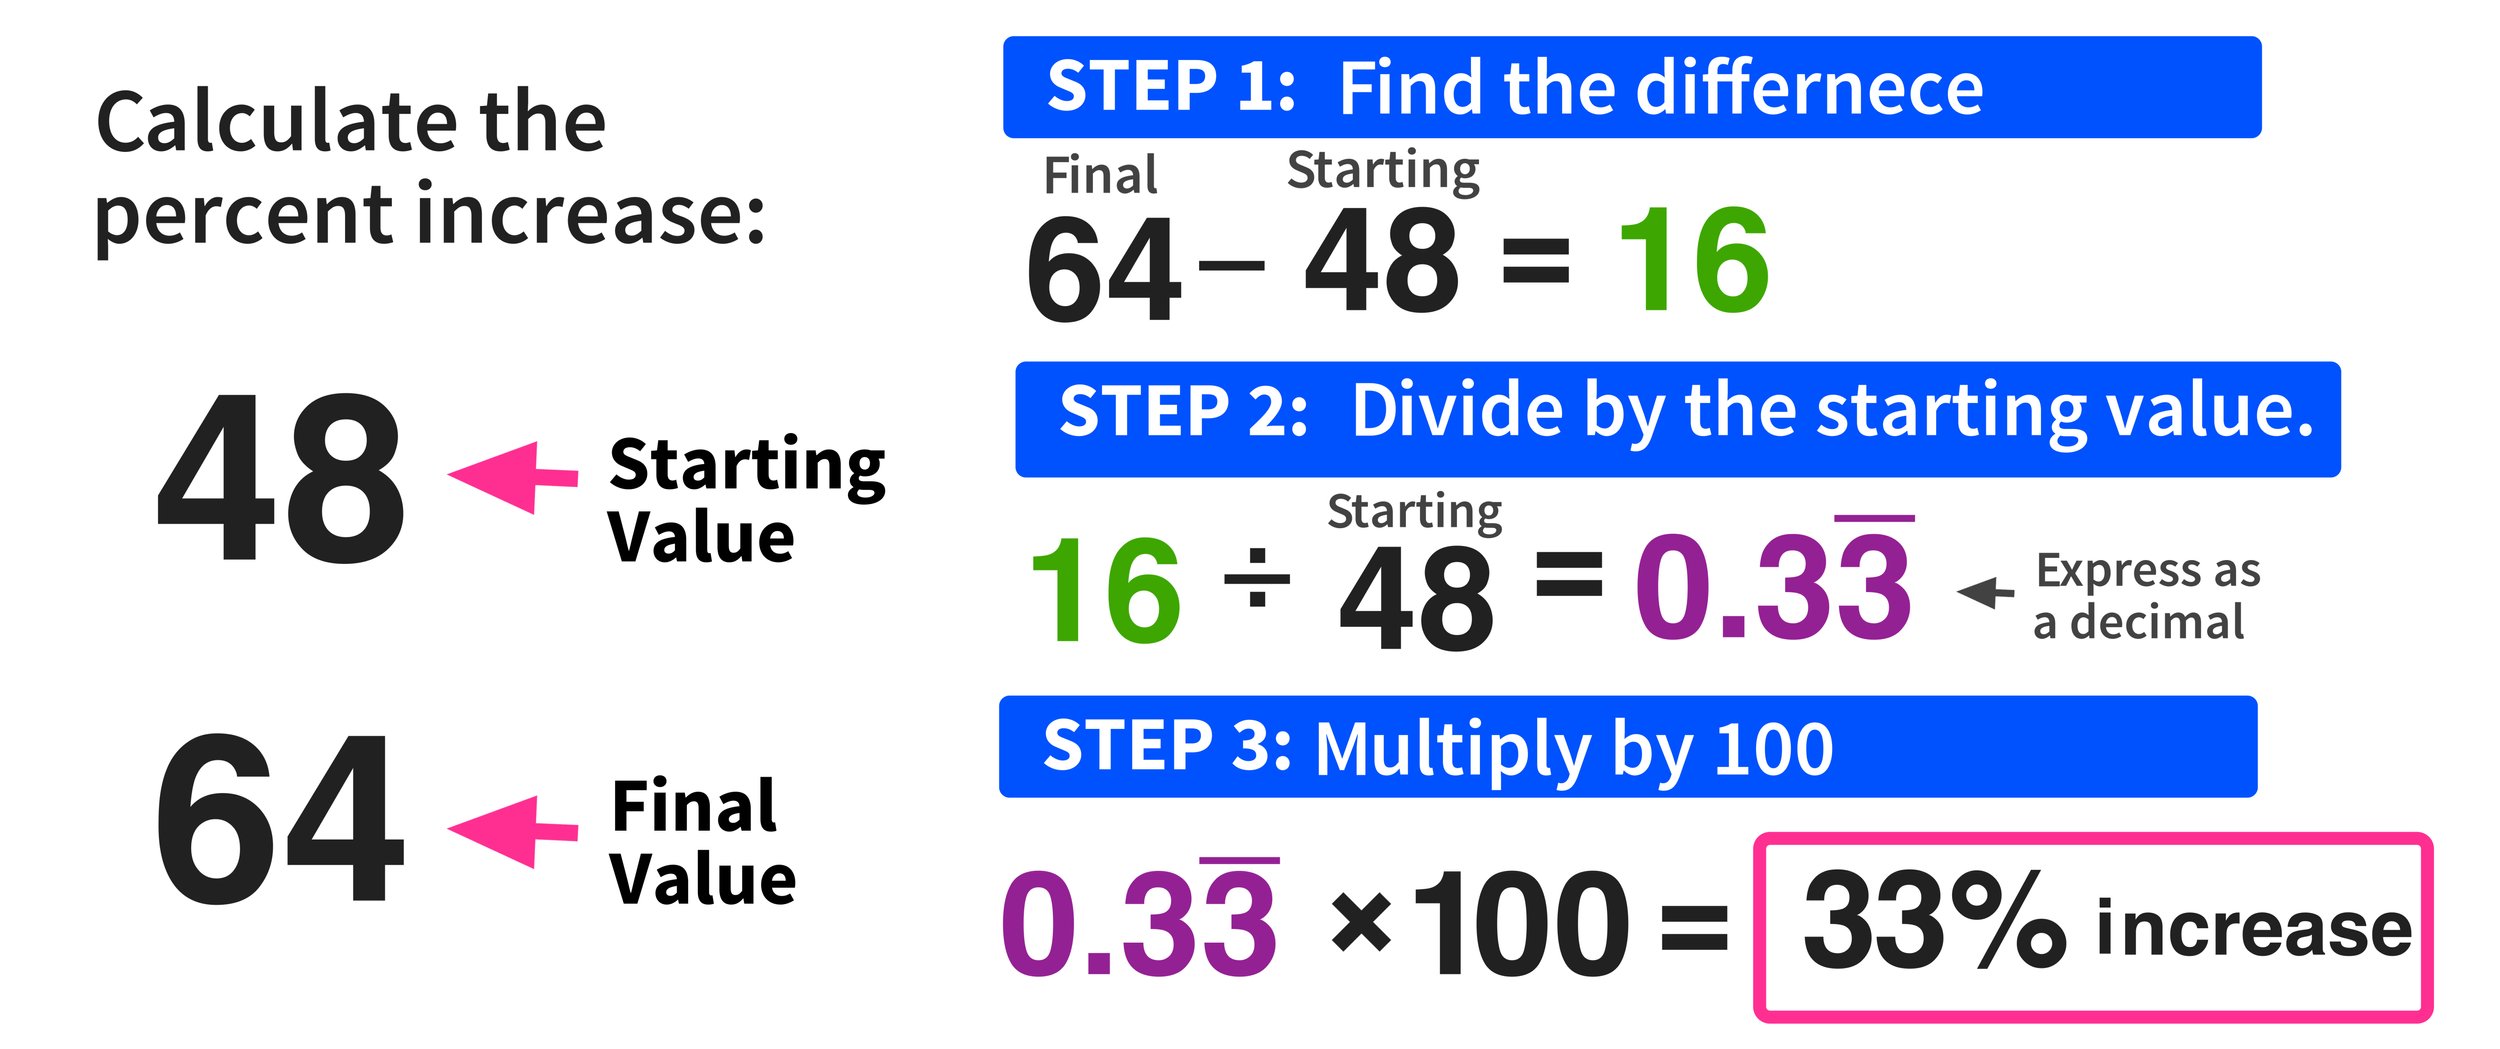
The standard formula for figuring a percent increase is:
[(New Value – Original Value) / Original Value] x 100 = Percent Increase
To execute this calculation effectively, follow these three steps:
-
Find the Difference: Subtract the original value from the new value to determine the absolute increase.
-
Divide by the Original: Take that difference and divide it by the original (starting) value. This gives you the decimal representation of the growth.
-
Convert to Percentage: Multiply the resulting decimal by 100 to arrive at the percentage.
For example, if a share of stock was purchased for $150 and is now worth $195, the calculation would look like this:
-
$195 – $150 = $45 (The absolute increase)
-
$45 / $150 = 0.3
-
0.3 x 100 = 30% increase
Real-World Applications in Personal Finance
In personal finance, we often use this formula to evaluate budget adjustments or savings goals. If you managed to save $500 last month and $650 this month, your savings rate increased by 30%. This metric is far more motivating and descriptive of your behavioral change than simply noting the $150 difference.
Furthermore, understanding percent increase is vital when looking at debt. If a credit card interest rate jumps from 15% to 18%, that is not a “3% increase”—it is a 3-percentage-point increase, which actually represents a 20% increase in the cost of borrowing. Distinguishing between these two concepts is essential for maintaining financial health.
Tracking Investment Performance and Portfolio Growth
For investors, percent increase is the primary metric for Return on Investment (ROI). It allows for the comparison of disparate asset classes, such as comparing the growth of a real estate holding against a high-yield savings account or a tech-heavy index fund.
Calculating ROI vs. Annualized Return
While a simple percent increase tells you how much an asset has grown since you bought it, professional investors often look at the time-weighted context. If Asset A grew by 50% over ten years and Asset B grew by 20% in one year, Asset B is the more efficient engine for wealth creation.
The simple percent increase formula provides the “Total Return.” To truly understand performance, investors must also consider the Compound Annual Growth Rate (CAGR). However, the foundational percent increase remains the starting point for all these advanced metrics. It tells the immediate story of capital appreciation and helps investors decide whether to hold, sell, or rebalance their positions.
The Impact of Compounding and Percent Increases
The “Rule of 72” is a popular financial shortcut that relies on the concept of annual percent increases. By dividing 72 by your expected annual percent increase, you can estimate how many years it will take for your investment to double. For instance, an investment with a consistent 6% annual increase will double in approximately 12 years.
Understanding how small percentage increases compound over time is the cornerstone of retirement planning. A 1% difference in annual fees on a 401(k) might seem negligible, but when viewed as a percentage of the total projected growth over thirty years, it can represent hundreds of thousands of dollars in lost opportunity.
Business Finance: Measuring Scalability and Profit Margins

In a corporate environment, percentage increases are the pulse of the company. Executives and stakeholders look at growth percentages to determine if a business model is scalable and if the company is capturing a larger share of the market.
Revenue Growth vs. Profit Increase
A common pitfall in business analysis is focusing solely on revenue increase while ignoring the percentage increase in expenses. If a company’s revenue increases by 20% but its operating expenses increase by 25%, the business is actually becoming less efficient despite “growing.”
To get a clear picture of financial health, analysts calculate:
-
Gross Profit Margin Increase: Measuring how much more efficient the production process has become.
-
Operating Margin Increase: Determining if the company is managing its overhead effectively as it scales.
-
Net Income Growth: The “bottom line” percentage that indicates the actual increase in take-home profit for the owners or shareholders.
Evaluating Year-over-Year (YoY) Performance
Business cycles are often seasonal. Comparing December sales to November sales might show a massive percentage increase, but that could be entirely due to the holiday season rather than actual business growth. This is why financial professionals rely on Year-over-Year (YoY) calculations.
By comparing the percent increase of Q3 this year to Q3 of last year, businesses can strip away seasonal noise and identify true growth trends. If a retail chain sees a 5% YoY increase in sales but a 10% YoY increase in digital traffic, the data suggests a pivot in consumer behavior that requires a strategic shift in marketing spend.
Navigating Inflation and Cost of Living Adjustments
In an inflationary environment, the nominal percent increase of your income may not reflect your actual financial status. This is where the distinction between “nominal” and “real” increases becomes critical.
Measuring Purchasing Power Erosion
Inflation is essentially a percentage increase in the general price level of goods and services. If the Consumer Price Index (CPI) indicates an annual inflation rate of 4%, your cost of living has increased by that percentage. To maintain your standard of living, your after-tax income must increase by at least the same percentage.
If you receive a 3% raise in a year where inflation is 5%, you have actually experienced a 2% decrease in “real” wages. Figuring the percent increase of your expenses versus the percent increase of your income is the only way to accurately track whether you are moving forward or backward financially.
Negotiating Salary Increases Based on Percentage
When entering a salary negotiation, coming prepared with percentage-based data is a powerful strategy. Instead of asking for a “round number” raise, frame the request around the value you have added. If you can demonstrate that you increased department efficiency by 15% or reduced costs by 10%, you have a mathematical basis for a corresponding percentage increase in your compensation. Professional environments respect data, and percentages provide a quantifiable measure of merit.
Common Pitfalls and Advanced Financial Metrics
While the formula for percent increase is simple, its application can lead to errors if the context is misunderstood. Accuracy in financial reporting requires a nuanced approach to how these numbers are presented.
The Difference Between Percentage Point and Percent Increase
One of the most frequent errors in financial media is the confusion between “percent” and “percentage points.” As mentioned earlier regarding interest rates, if a rate moves from 10% to 12%, that is a 2-percentage-point increase. However, the percent increase of the rate itself is actually 20% (since 2 is 20% of 10).
In business reporting, if your market share grows from 20% to 25%, you have gained 5 percentage points, but your business has grown by 25% relative to its previous position. Clear communication of these figures is vital to avoid misleading investors or management.
Using Percent Increases for Predictive Modeling
Financial analysts use historical percent increases to build predictive models for future performance. By looking at the average percentage growth of a company over the last five years, analysts can project future earnings per share (EPS). While past performance is never a guarantee of future results, the trend line established by consistent percentage increases is one of the most reliable indicators of a company’s trajectory.
In conclusion, figuring a percent increase is a versatile tool that transcends basic arithmetic. It is an essential lens through which we view investment success, business viability, and personal economic stability. By consistently applying this formula and understanding the context of the results, you can move beyond surface-level numbers and gain a deeper, more actionable understanding of your financial world. Whether you are managing a global portfolio or a household budget, the mastery of percentage growth is a cornerstone of long-term financial literacy.
aViewFromTheCave is a participant in the Amazon Services LLC Associates Program, an affiliate advertising program designed to provide a means for sites to earn advertising fees by advertising and linking to Amazon.com. Amazon, the Amazon logo, AmazonSupply, and the AmazonSupply logo are trademarks of Amazon.com, Inc. or its affiliates. As an Amazon Associate we earn affiliate commissions from qualifying purchases.