
In the modern financial landscape, the ability to interpret data is the bridge between guesswork and growth. Whether you are managing a personal portfolio, scaling a side hustle, or planning for a distant retirement, your progress is only as measurable as the metrics you track. Understanding how to calculate key financial figures allows you to strip away the emotional noise of market volatility and focus on the objective health of your capital.
Financial literacy is often discussed in broad strokes—saving more, spending less—but the granular math of money is where the real strategy happens. This guide provides a deep dive into the essential calculations every investor and earner should master to evaluate performance, mitigate risk, and project future wealth.
Measuring Investment Performance: Beyond Simple Gains
The most fundamental question any investor asks is, “How much did I make?” However, a simple dollar figure rarely tells the whole story. To understand if an investment is truly performing well relative to the market or your goals, you must use more sophisticated formulas.
Return on Investment (ROI)
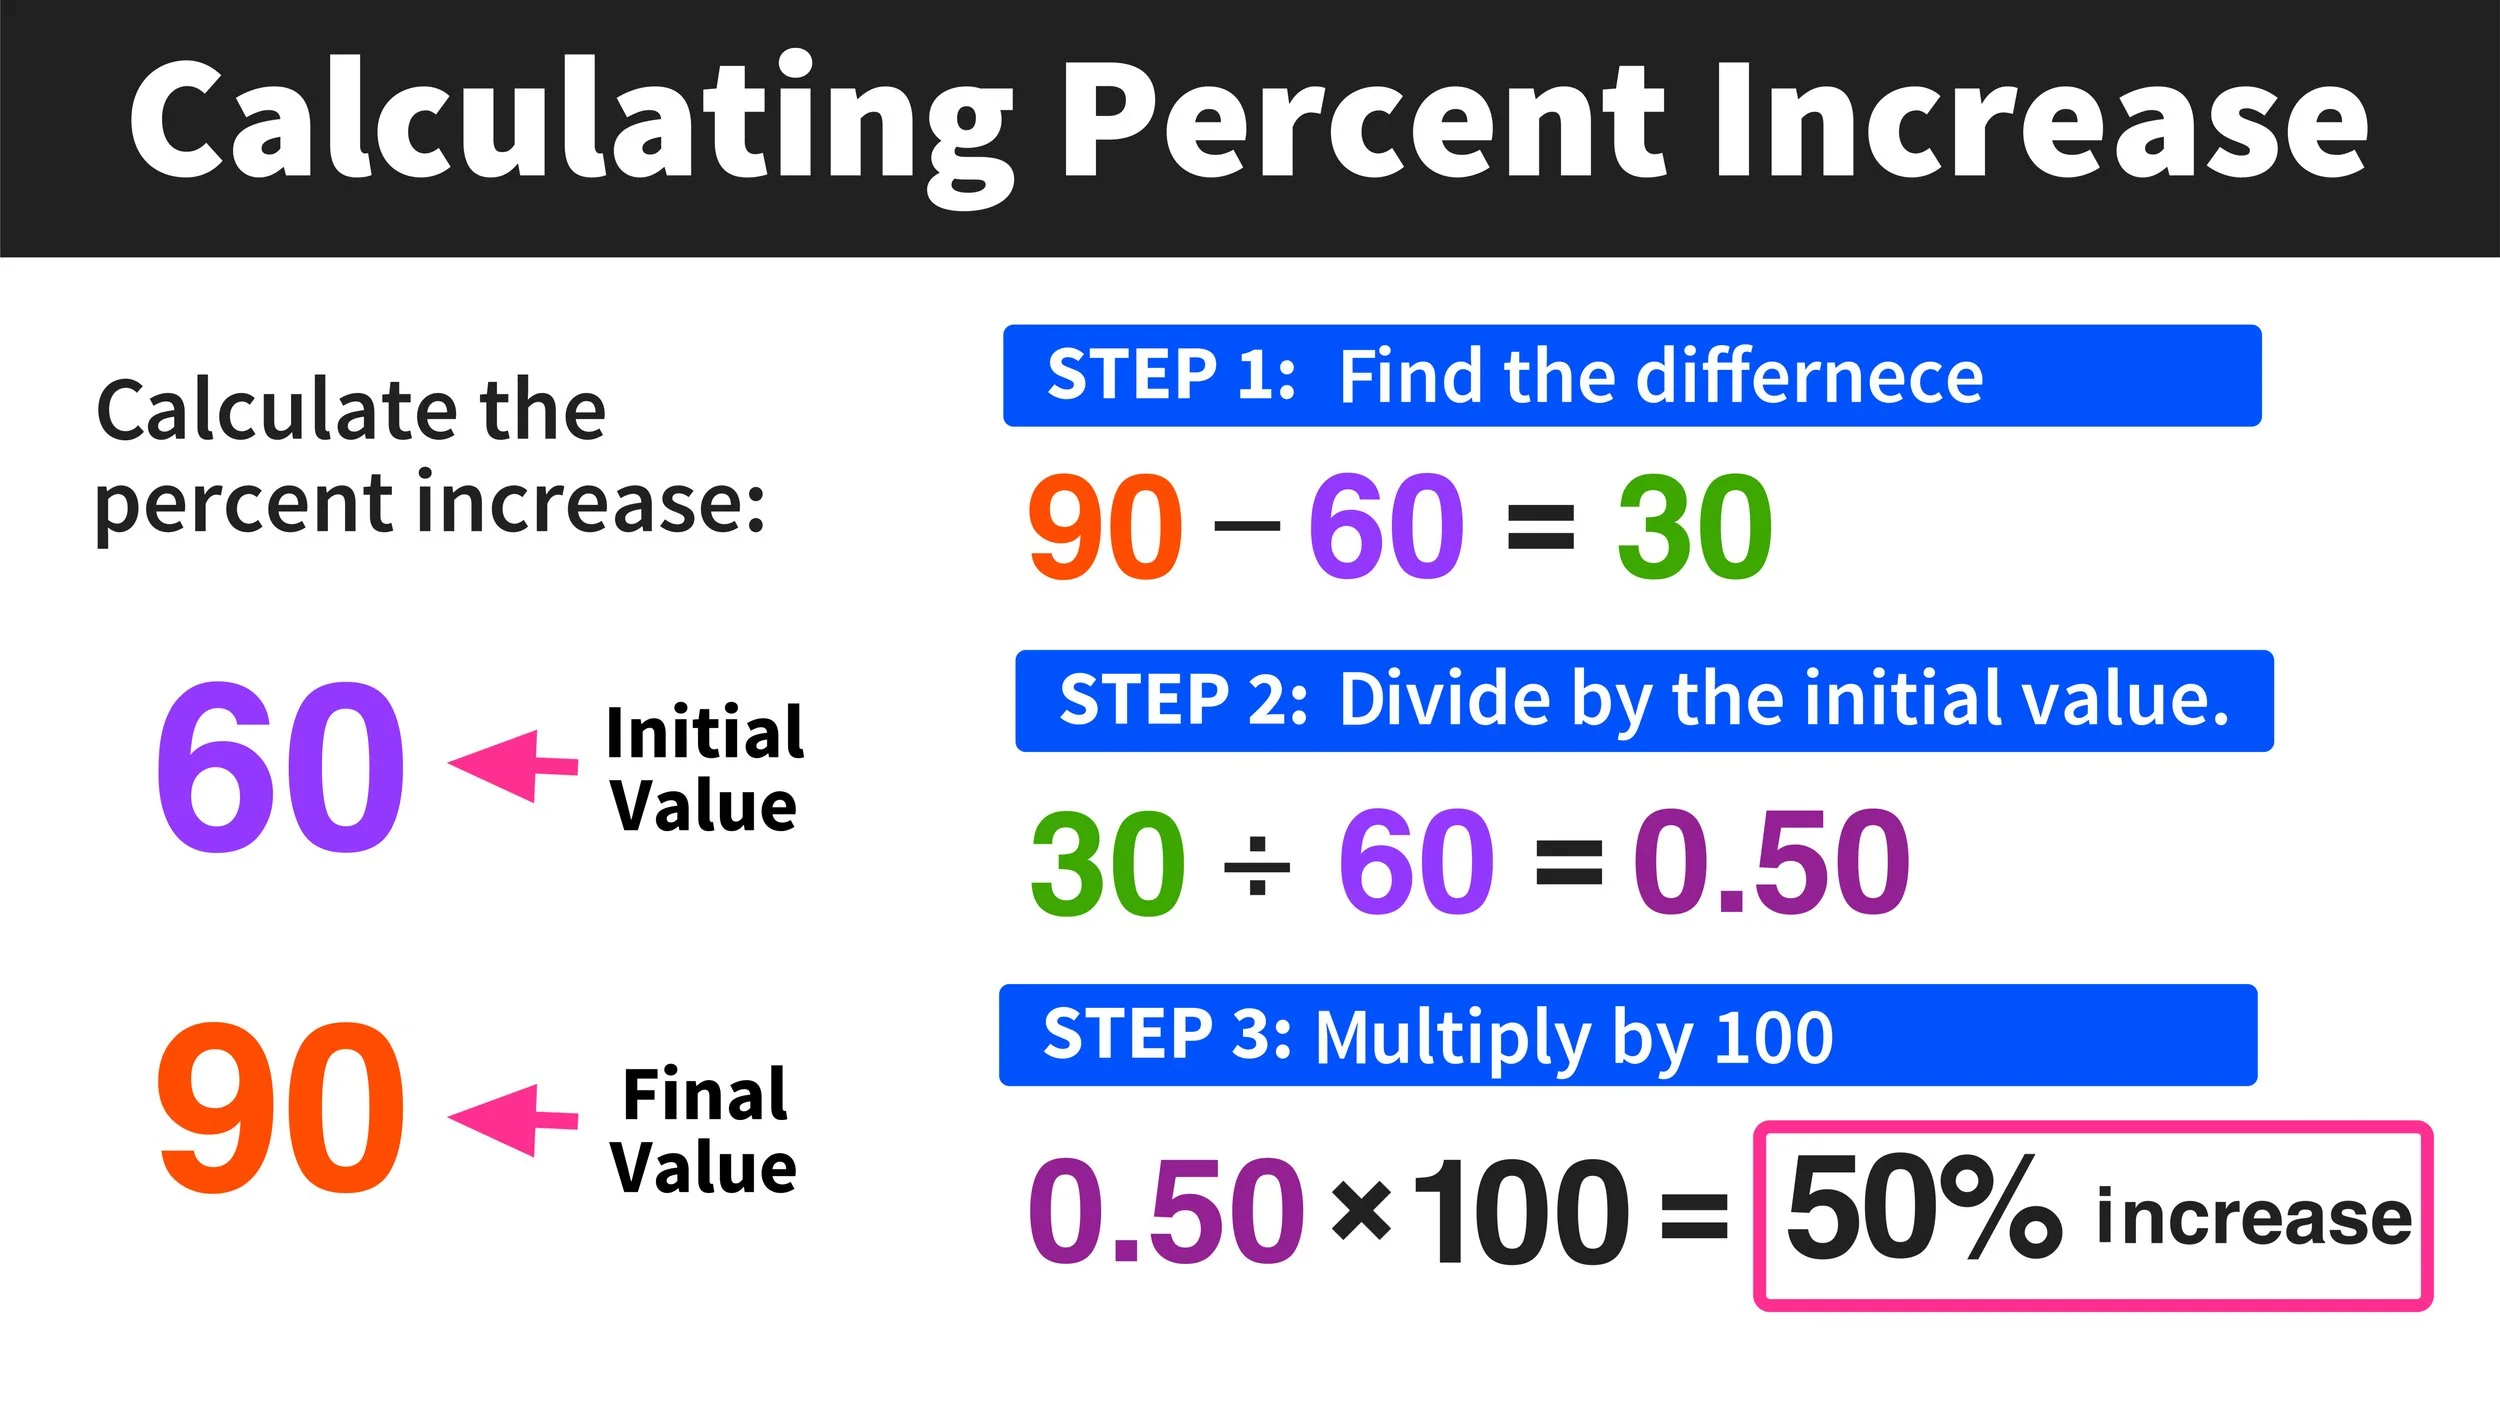
ROI is the most common metric used to evaluate the efficiency of an investment. It measures the gain or loss generated relative to the amount of money invested.
The Formula:
ROI = [(Current Value of Investment - Cost of Investment) / Cost of Investment] x 100
While ROI is excellent for a “snapshot” of success, its primary limitation is time. A 50% ROI is spectacular if achieved in one year, but lackluster if it took twenty years to realize.
Compound Annual Growth Rate (CAGR)
To account for the element of time, investors use CAGR. This metric provides a smoothed annual rate of return, assuming the investment compounded over a specific period. It is the gold standard for comparing the performance of different asset classes, such as stocks versus real estate, over several years.
The Formula:
CAGR = [(Ending Value / Beginning Value)^(1 / Number of Years)] - 1
By calculating CAGR, you can determine if your portfolio is actually beating inflation and matching the historical returns of broader indices like the S&P 500.
Real Rate of Return
In an inflationary environment, your nominal return (the number shown on your brokerage statement) can be misleading. The real rate of return adjusts your gains for the eroding purchasing power of currency.
The Formula:
Real Return = [(1 + Nominal Return) / (1 + Inflation Rate)] - 1
If your investments returned 7% last year but inflation was 4%, your “real” wealth only grew by roughly 3%. Calculating this helps you understand your true increase in purchasing power.
Assessing Personal Wealth: The North Star Metrics
Tracking individual investments is important, but personal finance requires a holistic view of your entire economic ecosystem. Two metrics stand above the rest for assessing long-term stability: Net Worth and the Liquidity Ratio.
Calculating Net Worth
Net worth is the ultimate scorecard in personal finance. It is a simple calculation of everything you own (assets) minus everything you owe (liabilities).
The Formula:
Net Worth = Total Assets - Total Liabilities
-
Assets: Include cash, brokerage accounts, retirement funds, home equity, and business interests.
-
Liabilities: Include mortgages, student loans, credit card balances, and car loans.
To get an accurate calculation, you must use conservative valuations. For example, when listing your home as an asset, use its estimated sale price minus closing costs, rather than a speculative “dream” price. Tracking your net worth quarterly allows you to see the “big picture” trend of your financial life.
The Liquidity Ratio
Wealth on paper is not the same as usable wealth. The liquidity ratio measures your ability to cover immediate expenses using only your most accessible assets (cash and cash equivalents).
The Formula:
Liquidity Ratio = Liquid Assets / Monthly Expenses
A result of 6.0 means you have six months of “runway” if your primary income source were to vanish. This calculation is the mathematical foundation for an emergency fund. Without knowing this number, you are either over-leveraged and at risk or holding too much cash and missing out on investment growth.
Managing Debt and Risk: Protective Calculations
Debt is a tool that can accelerate growth, but without proper calculation, it becomes a weight that stalls progress. Understanding how to measure your debt burden is critical for maintaining a high credit score and securing future financing.

Debt-to-Income Ratio (DTI)
Lenders use DTI to determine your creditworthiness, but you should use it to determine your own safety margin. It compares your total monthly debt payments to your gross monthly income.
The Formula:
DTI = (Total Monthly Debt Payments / Gross Monthly Income) x 100
A DTI of 36% or lower is generally considered healthy. If your DTI climbs toward 50%, a significant portion of your income is “pre-spent,” leaving little room for investing or handling emergencies.
The Break-Even Point for Refinancing
When interest rates shift, many homeowners and business owners look to refinance debt. However, refinancing often comes with closing costs. To decide if the move is profitable, you must calculate the break-even point.
The Formula:
Break-Even (Months) = Total Closing Costs / Monthly Interest Savings
If it costs $5,000 to refinance your mortgage but saves you $200 a month, it will take 25 months to break even. If you plan to sell the property in two years, the calculation shows that refinancing would actually result in a net loss.
Business and Side Hustle Profitability: The Entrepreneur’s Math
In the age of the creator economy and digital entrepreneurship, many individuals manage side hustles that require a business-minded approach to finance. Standard “profit” calculations often overlook the hidden costs of doing business.
Gross Profit Margin
This metric tells you how much of every dollar earned is kept after accounting for the Direct Cost of Goods Sold (COGS). For digital products, this might be software fees; for physical goods, it’s materials and shipping.
The Formula:
Gross Profit Margin = [(Total Revenue - COGS) / Total Revenue] x 100
A high margin suggests a scalable business, while a low margin indicates that you may need to increase prices or find more efficient suppliers to make the venture worth your time.
The Value of Your Time (Internal Rate of Return on Effort)
While not a standard accounting term, many solo entrepreneurs fail because they don’t calculate their effective hourly rate.
The Formula:
Effective Hourly Rate = Net Profit / Total Hours Invested
If your side hustle generates $1,000 a month in profit but requires 80 hours of work, your rate is $12.50/hour. By calculating this, you can objectively decide whether to continue the venture, automate tasks, or pivot to a higher-leverage opportunity.
Planning for the Future: Projections and Probabilities
The final stage of financial calculation involves looking forward. How do you know if you are saving enough? How do you know when you can stop working?
The Rule of 72
The Rule of 72 is a simplified way to estimate how long it will take for an investment to double in value, given a fixed annual rate of interest.
The Formula:
Years to Double = 72 / Annual Rate of Return
If you expect an 8% return from the stock market, your money will double roughly every 9 years. This mental shortcut is invaluable for long-term planning and understanding the power of compounding.
The 4% Rule (The Safe Withdrawal Rate)
To calculate how much you need to retire, the 4% rule is a widely accepted benchmark. It suggests that you can withdraw 4% of your total portfolio value in the first year of retirement (and adjust for inflation thereafter) with a high probability of the money lasting 30 years.
The Formula (Reverse):
Retirement Target = Annual Expected Expenses x 25
If you need $60,000 per year to live, you would need a portfolio of $1.5 million. This calculation provides a tangible “finish line” for your wealth-building journey.
The Impact of Expense Ratios
In investing, what you don’t pay is as important as what you earn. Management fees (expense ratios) in mutual funds or ETFs can quietly erode your wealth over decades.
To calculate the impact, use a future value calculator to compare a 0.05% fee (common for index funds) versus a 1.0% fee (common for active funds). Over a 30-year career with a $100,000 starting balance, that 0.95% difference can result in hundreds of thousands of dollars in “lost” growth.
Conclusion: The Discipline of Documentation
Calculations are the language of financial clarity. By moving from “feeling” successful to “calculating” success, you gain the ability to make dispassionate, data-driven decisions. Whether you are optimizing your debt-to-income ratio to buy a home or calculating the CAGR of your stock portfolio, these formulas provide the feedback loop necessary for continuous improvement. Wealth is rarely the result of luck; more often, it is the result of a disciplined adherence to the math of money.
aViewFromTheCave is a participant in the Amazon Services LLC Associates Program, an affiliate advertising program designed to provide a means for sites to earn advertising fees by advertising and linking to Amazon.com. Amazon, the Amazon logo, AmazonSupply, and the AmazonSupply logo are trademarks of Amazon.com, Inc. or its affiliates. As an Amazon Associate we earn affiliate commissions from qualifying purchases.