
The question “when was the financial crash” often serves as a starting point for investors seeking to understand the volatile nature of global markets. However, economic history is not defined by a single event but rather by a series of systemic failures, speculative bubbles, and subsequent corrections. From the Great Depression of 1929 to the Great Recession of 2008 and the pandemic-induced flash crash of 2020, understanding these timelines is essential for anyone looking to navigate the complexities of personal finance and institutional investing.
Financial crashes are often characterized by a sudden, dramatic drop in stock prices across a cross-section of the market. These events are typically triggered by a combination of economic factors, investor psychology, and the bursting of overextended speculative bubbles. By examining the most significant crashes in history, we can extract valuable lessons on risk management, asset allocation, and the cyclical nature of wealth.
The Landmarks of Economic Downturn: A Chronology of Major Crashes
While many people immediate think of 2008 when the term “financial crash” is mentioned, the history of market collapses spans centuries. Each event offers a unique blueprint of how euphoria can turn into panic, leading to a rapid devaluation of assets.
The Great Depression (1929)
The most infamous crash in history began on October 24, 1929, known as Black Thursday. Following a decade of unprecedented prosperity known as the Roaring Twenties, the stock market had become a playground for speculative excess. High levels of margin debt—where investors borrowed money to buy stocks—created a fragile foundation. When the bubble burst, the Dow Jones Industrial Average plummeted, wiping out fortunes overnight. This crash led to a decade-long economic depression, fundamentally changing how governments regulate financial institutions.
Black Monday (1987)
On October 19, 1987, the world witnessed the largest one-day percentage drop in stock market history. The Dow Jones fell by over 22% in a single session. Unlike the 1929 crash, which was tied to fundamental economic decay, the 1987 crash is often attributed to the rise of program trading and portfolio insurance. These automated systems triggered a cascade of sell orders as prices fell, creating a feedback loop of panic. It was a watershed moment that highlighted the risks of technological integration in finance.
The Dot-Com Bubble (2000)
The turn of the millennium saw the collapse of the technology-heavy Nasdaq. Investors had poured billions into internet startups that lacked clear paths to profitability, driven by the fear of missing out (FOMO) on the “new economy.” When the reality of earnings failed to meet the hype, the Nasdaq lost 76% of its value from its peak in March 2000 to its bottom in October 2002. This period taught investors that even transformative technology cannot escape the fundamental laws of valuation.
Anatomy of the 2008 Global Financial Crisis
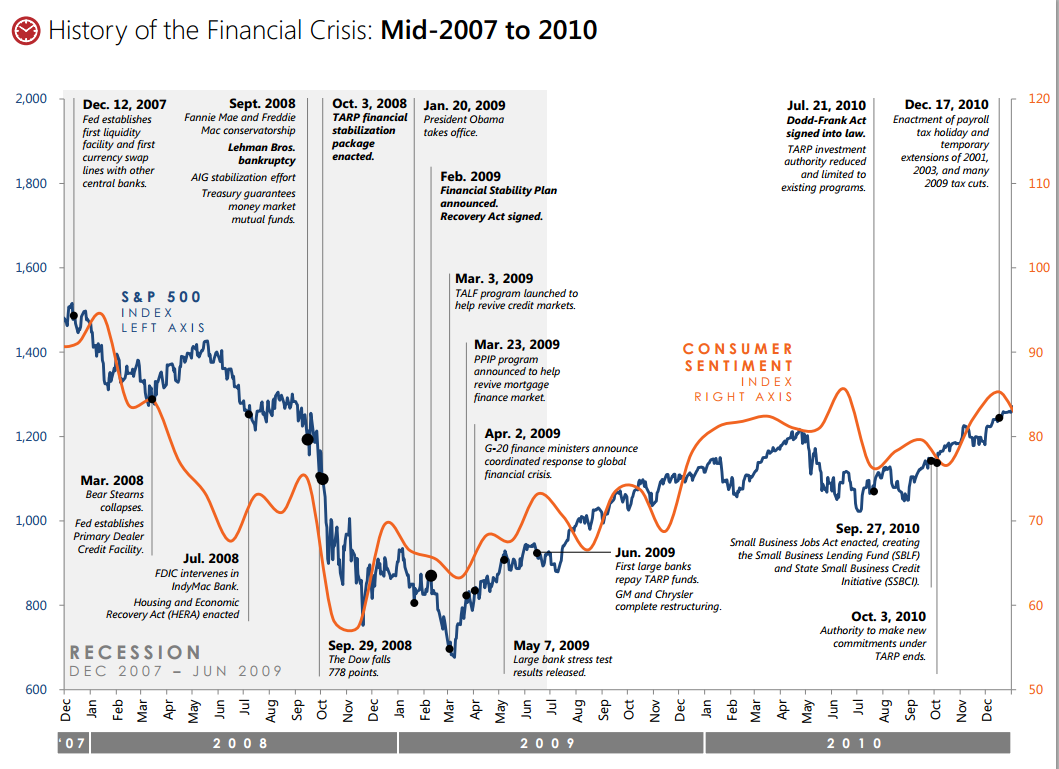
The 2008 crash, often referred to as the Global Financial Crisis (GFC), remains the most significant economic event of the 21st century. It was a systemic failure that nearly brought down the global banking system and led to the “Great Recession.”
The Housing Bubble and Subprime Mortgages
The seeds of the 2008 crash were sown in the early 2000s through a combination of low interest rates and relaxed lending standards. Financial institutions began issuing subprime mortgages to borrowers with poor credit histories. These risky loans were then bundled into complex financial products called mortgage-backed securities (MBS) and sold to investors worldwide. The assumption was that housing prices would rise indefinitely, making these securities a safe bet.
The Collapse of Lehman Brothers
By 2007, the housing bubble began to deflate. As interest rates rose, subprime borrowers defaulted on their loans, causing the value of mortgage-backed securities to plummet. In September 2008, the venerable investment bank Lehman Brothers filed for bankruptcy, sending shockwaves through the global economy. The interbank lending market froze as institutions lost trust in one another’s solvency. This “liquidity crunch” meant that businesses could no longer access the credit they needed to operate, leading to massive layoffs and a sharp contraction in GDP.
Global Contagion and the Aftermath
The 2008 crisis was not confined to the United States. Because global banks were heavily invested in American mortgage debt, the crisis spread rapidly to Europe and Asia. Governments were forced to intervene with massive bailouts to prevent a total systemic collapse. The recovery was slow, characterized by years of low interest rates and the introduction of “quantitative easing” by central banks—a policy of injecting liquidity into the economy that continues to influence market dynamics today.
Modern Volatility: The 2020 Flash Crash and Beyond
The most recent entry into the history of financial crashes occurred in early 2020. Unlike previous crashes driven by internal economic imbalances, this was an exogenous shock caused by a global health emergency.
The Fastest Bear Market in History
In February and March 2020, as the COVID-19 pandemic forced global lockdowns, the S&P 500 experienced its fastest decline from all-time highs into bear market territory (a 20% drop). In just 22 trading days, trillions of dollars in market value evaporated. The uncertainty regarding the duration of the pandemic and its impact on consumer spending created a vacuum of confidence.
The Role of Central Bank Intervention
What made the 2020 crash unique was the speed of the recovery. Central banks, led by the Federal Reserve, responded with unprecedented force, cutting interest rates to near zero and launching massive asset-purchase programs. Coupled with significant fiscal stimulus from governments, the markets staged a “V-shaped” recovery, reaching new all-time highs by late 2020. This event underscored the growing influence of monetary policy on asset prices and how “liquidity” can act as a buffer against economic reality.
Strategies for Protecting Wealth During Market Turmoil
For the individual investor, the question isn’t just “when was the crash,” but “how do I survive the next one?” History shows that crashes are inevitable, but they are also temporary.
Asset Allocation and Diversification
The most effective defense against a financial crash is a well-diversified portfolio. By spreading investments across different asset classes—such as stocks, bonds, real estate, and commodities—investors can reduce the impact of a decline in any single sector. During the 2008 crisis, while stocks plummeted, high-quality government bonds often held their value or increased, providing a crucial cushion for diversified portfolios.
The Importance of Liquidity
A common mistake during a crash is being “all-in” on illiquid or volatile assets. Maintaining a cash reserve or an emergency fund ensures that you are not forced to sell your investments at the bottom of the market to cover living expenses. Liquidity also provides the “dry powder” needed to take advantage of buying opportunities when asset prices are depressed.
Dollar-Cost Averaging through Volatility
Trying to time the exact bottom of a crash is notoriously difficult. Instead, many successful investors utilize dollar-cost averaging (DCA). By investing a fixed amount of money at regular intervals, you automatically buy more shares when prices are low and fewer when prices are high. This disciplined approach removes the emotional stress of market timing and leverages volatility to lower your average cost basis over time.
Learning from History: How to Spot the Red Flags
While every financial crash is different, they often share common warning signs. Recognizing these “red flags” can help investors adjust their risk tolerance before the bubble bursts.
Market Sentiment and Irrational Exuberance
Alan Greenspan, former Chairman of the Federal Reserve, famously used the term “irrational exuberance” to describe the behavior of investors during the late 1990s. When market participants become overly optimistic, ignore traditional valuation metrics (like price-to-earnings ratios), and believe that “this time is different,” a crash is often on the horizon. Speculative manias, such as the craze for meme stocks or unbacked digital assets, often signal that the market is overextended.
Economic Indicators to Watch
Financial professionals keep a close eye on specific indicators that historically precede downturns. One of the most reliable is the “inverted yield curve,” which occurs when short-term interest rates are higher than long-term rates. This inversion suggests that investors have a pessimistic outlook on the economy’s future. Additionally, rising corporate debt levels and tightening credit conditions are often precursors to a liquidity crisis.
In conclusion, the history of financial crashes—from 1929 to 2020—serves as a powerful reminder that markets move in cycles. While the “when” of the next crash is impossible to predict with certainty, the patterns of the past provide a roadmap for the future. By focusing on fundamental value, maintaining a long-term perspective, and adhering to disciplined risk management strategies, investors can protect their wealth and even thrive during periods of economic uncertainty. Understanding the history of these events is not merely an academic exercise; it is a fundamental requirement for financial literacy in an increasingly complex global economy.
aViewFromTheCave is a participant in the Amazon Services LLC Associates Program, an affiliate advertising program designed to provide a means for sites to earn advertising fees by advertising and linking to Amazon.com. Amazon, the Amazon logo, AmazonSupply, and the AmazonSupply logo are trademarks of Amazon.com, Inc. or its affiliates. As an Amazon Associate we earn affiliate commissions from qualifying purchases.