
Investing in the stock market is often portrayed as either a get-rich-quick scheme or an impenetrable maze of complex mathematics. In reality, successful stock market investing is a disciplined process of evaluating businesses. When you buy a stock, you are not just buying a ticker symbol on a screen; you are purchasing a fractional ownership stake in a living, breathing corporation. To navigate this landscape effectively, an investor must look beyond price fluctuations and focus on the underlying value of the enterprise.
Developing a robust framework for stock selection requires a blend of quantitative analysis—looking at the numbers—and qualitative analysis—evaluating the story and the people behind the business. Whether you are a value investor looking for underpriced gems or a growth investor seeking the next industry leader, certain fundamental pillars remain constant.
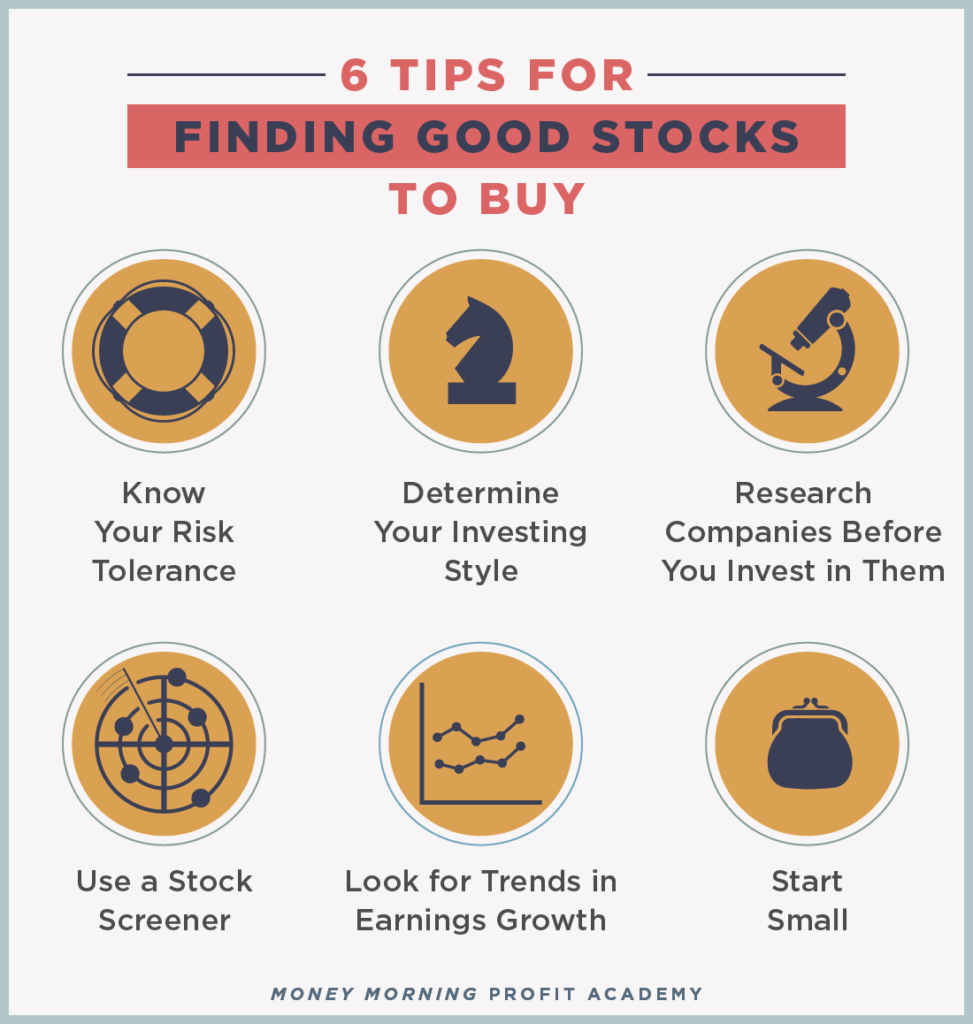
Fundamental Analysis: Assessing the Company’s Financial Health
The first step in evaluating any stock is a deep dive into its financial statements. Fundamental analysis provides the “truth” about a company’s performance, stripped of marketing hype and market sentiment. While the past does not guarantee future results, it provides a roadmap of how management handles capital and navigates economic cycles.
Revenue and Earnings Growth
Revenue, often called the “top line,” represents the total amount of money a company brings in from its operations. Consistent revenue growth over a five-to-ten-year period indicates that the company’s products or services are in demand and that it is successfully capturing market share. However, revenue alone is not enough.
Earnings per share (EPS) is the “bottom line” and represents the portion of a company’s profit allocated to each outstanding share of common stock. Investors should look for “quality” earnings—meaning the profits are derived from core business operations rather than one-time accounting maneuvers or asset sales. A company that grows revenue while simultaneously expanding its profit margins is a powerful wealth-creation engine.
Profit Margins and Operating Efficiency
Profit margins tell you how much of every dollar of sales a company actually keeps. Gross margin reflects the cost of producing goods, while operating margin accounts for the costs of running the business, such as marketing and R&D. High and stable margins often suggest that a company has “pricing power,” meaning it can raise prices without losing customers to competitors. If margins are shrinking, it may be a sign of increased competition or rising input costs that the company cannot pass on to its consumers.
Debt-to-Equity and the Balance Sheet
A company’s balance sheet reveals its financial stability. The debt-to-equity ratio is a critical metric that compares a company’s total liabilities to its shareholder equity. While some debt can be used strategically to fund growth, excessive leverage makes a company vulnerable during economic downturns.
Investors should prioritize companies with manageable debt loads and high “current ratios” (the ability to pay off short-term liabilities with short-term assets). A “fortress balance sheet” with ample cash reserves provides a company the flexibility to acquire competitors, invest in innovation, or weather a recession without diluting shareholders through emergency stock offerings.
Market Position and the Competitive Moat
Beyond the numbers, you must evaluate the company’s “moat”—a term popularized by Warren Buffett. A moat is a structural competitive advantage that protects a company from competitors, allowing it to maintain high profit margins over the long term. Without a moat, even a profitable business will eventually see its margins eroded as rivals move in to capture the excess returns.
Brand Loyalty and Intangible Assets
A strong brand is one of the most effective moats. When consumers are willing to pay a premium for a product simply because of the logo it carries, the company possesses significant pricing power. This intangible asset creates a barrier to entry that is incredibly difficult for startups to replicate. Similarly, patents and proprietary technology serve as legal moats, preventing competitors from duplicating a company’s core product for a set period.
The Network Effect
The network effect occurs when a product or service becomes more valuable as more people use it. This is commonly seen in social media platforms, payment networks, and online marketplaces. Once a company reaches a critical mass of users, it becomes nearly impossible for a competitor to displace them, as the “switching cost” for the user base is too high. Identifying companies that benefit from this dynamic can lead to long-term compounding growth.
Economies of Scale and Cost Leadership
Large companies often benefit from economies of scale, allowing them to produce goods at a lower unit cost than smaller competitors. This cost advantage can be used to either underprice the competition or reinvest the savings into further innovation. A company that is a “low-cost producer” in its industry is often the last one standing during a price war, making it a safer long-term investment.
Valuation Metrics: Determining the Right Price
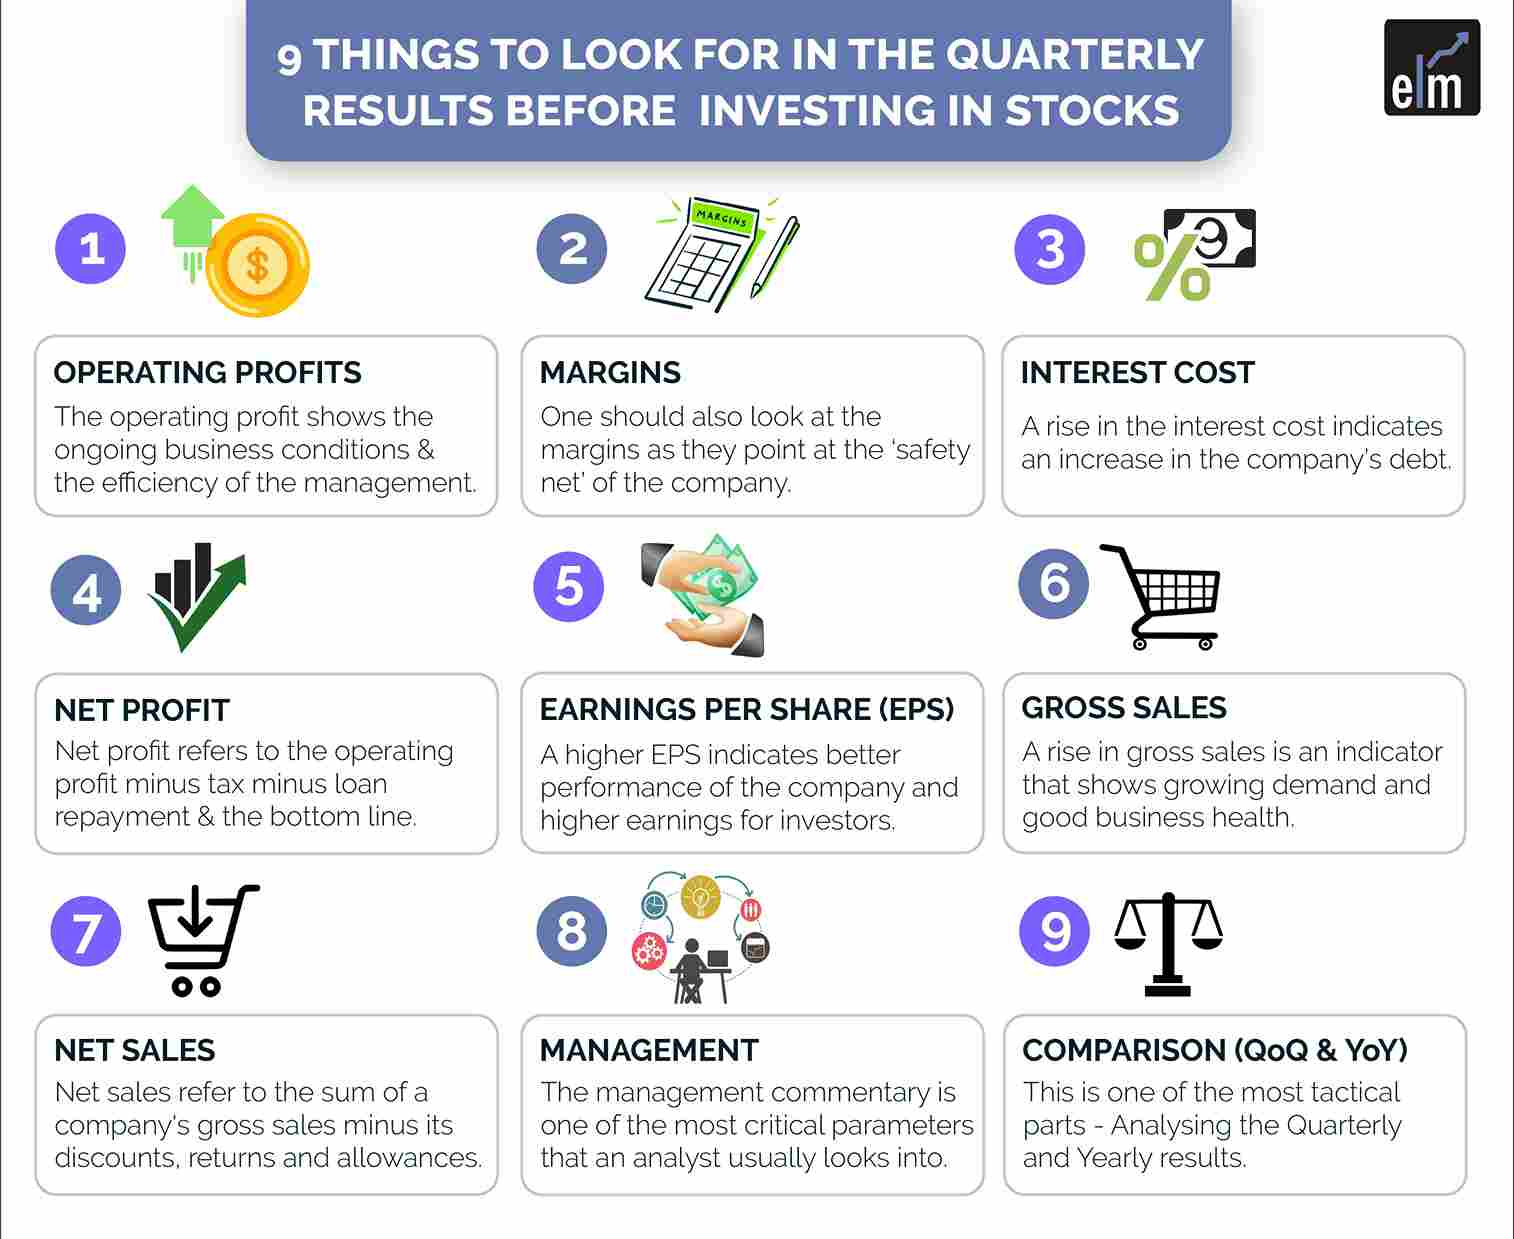
Even the greatest company in the world can be a poor investment if you pay too much for it. Valuation is the art of determining what a business is worth relative to its current stock price. A stock’s price is merely what you pay; the value is what you get.
The Price-to-Earnings (P/E) Ratio
The P/E ratio is the most common valuation tool, calculated by dividing the stock price by its annual earnings per share. A high P/E might indicate that the market expects high growth in the future, while a low P/E might suggest the stock is undervalued or that the company is facing systemic issues.
It is vital to compare a company’s P/E ratio against its historical average and its industry peers. A tech company might naturally carry a higher P/E than a utility company, but if a stock’s P/E is significantly higher than its own five-year average without a corresponding increase in growth, it may be overextended.
The PEG Ratio (Price/Earnings to Growth)
The PEG ratio provides a more complete picture than the P/E ratio alone because it factors in the company’s expected growth rate. A company with a P/E of 30 might seem expensive, but if it is growing earnings at 30% per year, its PEG ratio is 1.0, which is often considered fair value. Conversely, a company with a P/E of 15 and only 5% growth has a PEG of 3.0, suggesting it may actually be overpriced despite the lower P/E.
Dividend Yield and Payout Ratio
For income-focused investors, the dividend yield—the annual dividend payment divided by the stock price—is a key metric. However, a high yield can be a “value trap” if it is unsustainable. Investors should check the “payout ratio,” which is the percentage of earnings paid out as dividends. A payout ratio below 60% generally suggests the dividend is safe and has room to grow, while a ratio exceeding 90% may indicate that the company is at risk of cutting its dividend if earnings dip.
Qualitative Factors: Leadership and Industry Trends
A company is only as good as the people running it and the environment in which it operates. Qualitative factors are harder to quantify but are equally important in determining the long-term trajectory of a stock.
Management and Corporate Governance
When you invest in a stock, you are trusting the management team to be good stewards of your capital. Look for leaders with a proven track record of integrity and successful execution. Review the “Management Discussion and Analysis” (MD&A) section of annual reports to see if leadership is transparent about mistakes and clear about future strategy.
Furthermore, check for “insider ownership.” When CEOs and board members own a significant amount of company stock, their interests are aligned with yours. If management is selling off large portions of their holdings, it may be a red flag that they lack confidence in the company’s future.
Industry Tailwinds and Headwinds
A company can be well-managed and financially sound but still fail if it is in a dying industry. Conversely, a mediocre company in a rapidly expanding sector can sometimes deliver surprising returns. Investors should look for “secular trends”—long-term shifts in technology, demographics, or consumer behavior that will act as a tailwind for specific industries.
Examples include the transition to renewable energy, the aging global population, or the increasing digitization of the global economy. Identifying companies that are positioned to benefit from these shifts is a core component of thematic investing.
Risk Assessment and Portfolio Construction
No investment is without risk. Part of knowing what to look for in a stock is knowing what could go wrong. A disciplined investor performs a “pre-mortem” by imagining the company has failed five years from now and identifying the most likely causes.
Understanding Beta and Volatility
Beta is a measure of a stock’s volatility in relation to the overall market. A beta of 1.0 means the stock tends to move with the market. A beta higher than 1.0 indicates higher volatility, while a beta lower than 1.0 suggests the stock is more stable. High-beta stocks can offer higher returns during bull markets but can lead to significant losses during downturns. Investors must align the risk profile of their stock selections with their personal risk tolerance and investment horizon.
Diversification and Correlation
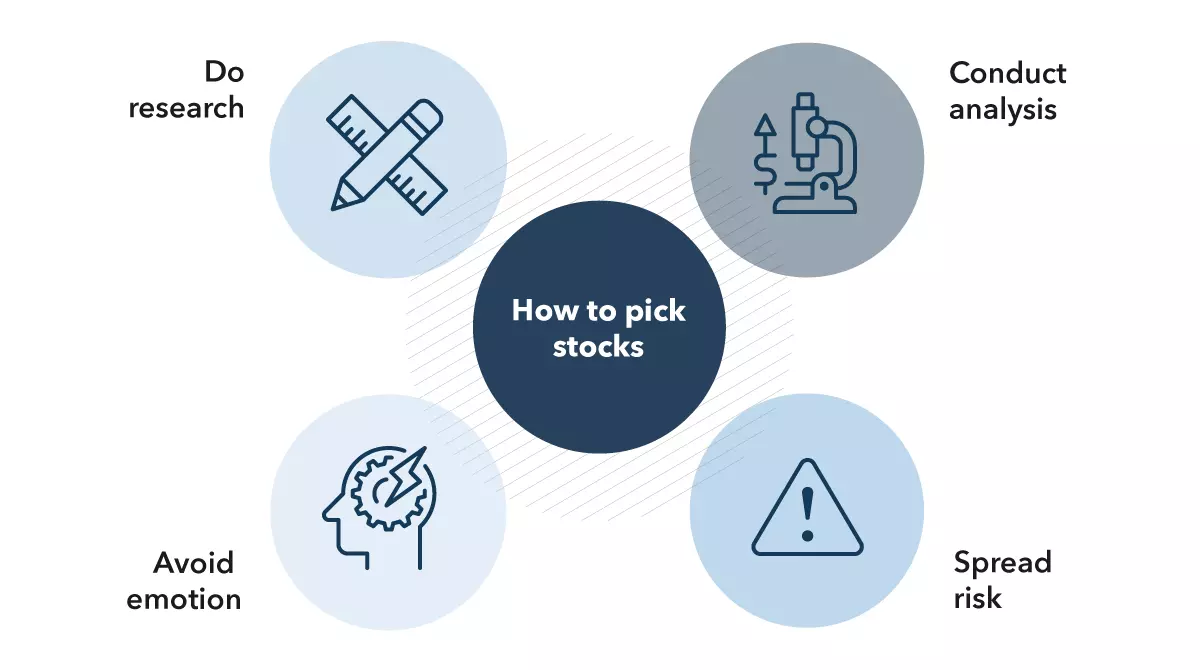
Finally, consider how a new stock fits into your existing portfolio. If you already own five tech stocks, adding a sixth—even if it is a great company—increases your concentration risk in that sector. Look for stocks with low correlation to your current holdings to ensure that a downturn in one industry doesn’t wipe out your entire portfolio.
True diversification involves owning companies of different sizes (market caps), in different industries, and even in different geographic regions. By focusing on a combination of financial strength, competitive advantage, reasonable valuation, and sound management, you can build a resilient portfolio capable of generating long-term wealth. Investing in stocks is a marathon, not a sprint, and the most successful participants are those who do their homework before placing their bets.
aViewFromTheCave is a participant in the Amazon Services LLC Associates Program, an affiliate advertising program designed to provide a means for sites to earn advertising fees by advertising and linking to Amazon.com. Amazon, the Amazon logo, AmazonSupply, and the AmazonSupply logo are trademarks of Amazon.com, Inc. or its affiliates. As an Amazon Associate we earn affiliate commissions from qualifying purchases.